Average Household Debt in Singapore
Get the Best Personal Loans in Singapore
Singapore media has been writing alarming reports about rising level of debt in Singapore. In order to help our readers truly understand this topic’s main issues, we have researched this topic in depth. Our analysts found the average debt per Singaporean household to be S$55,112 per capita. Combined data from the Department of Statics Singapore and other government agencies allowed us to dive deeper into household debt in Singapore, and look beyond the face value of those two figures. Below you'll find some of the most prominent trends that emerged from the available data.
Key Findings
- Average Household Debt per Capita: S$57,637
- Total Outstanding Singaporean Consumer Debt: S$384.9bn
- High interest debt like credit cards and personal loans have been the fastest growing debt category, now comprising +21.8% of total household liabilities.
- Household debt level seems on par with other developed countries that have been suffering from low income growth and high cost of living like Korea and the US.
Average Household Debt by Category
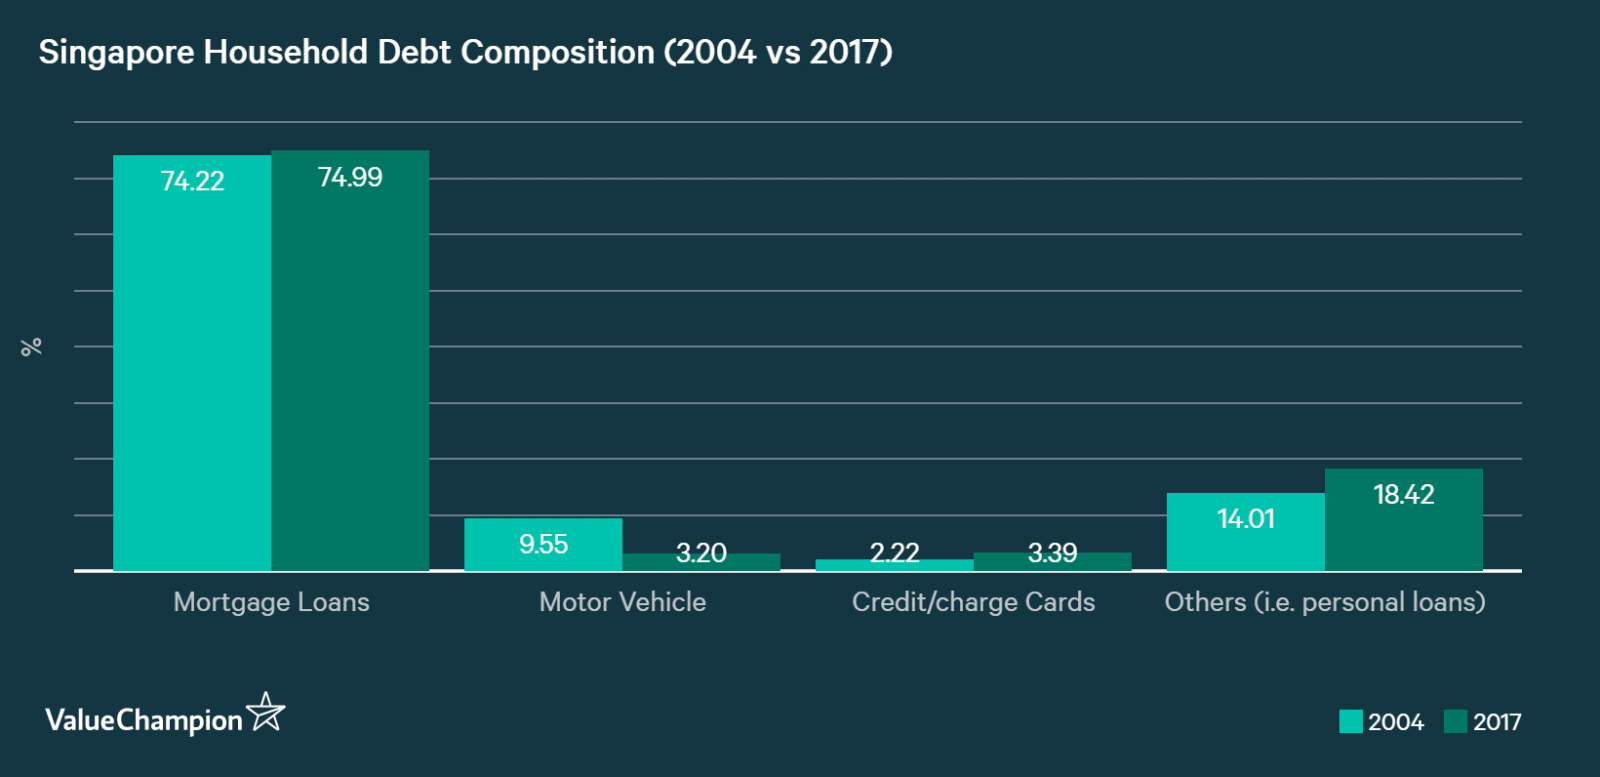
According to data from the Department of Statics Singapore, the average household debt of Singaporeans about S$67,692 per capita as of March 2022, with household debt growing by 6.8% over the course of 2021. To calculate this measure, we utilized the data collected by the government every 3 months on household debt and population, which represents the most reliable measure of consumer indebtedness in the country. Most of this debt is home loans, which comprises of 75% of household debt in Singapore. Other main categories include motor loans (3.2%), credit card debt (3.4%) and others (18.4%), which includes personal loans, educations and other alternative loans.
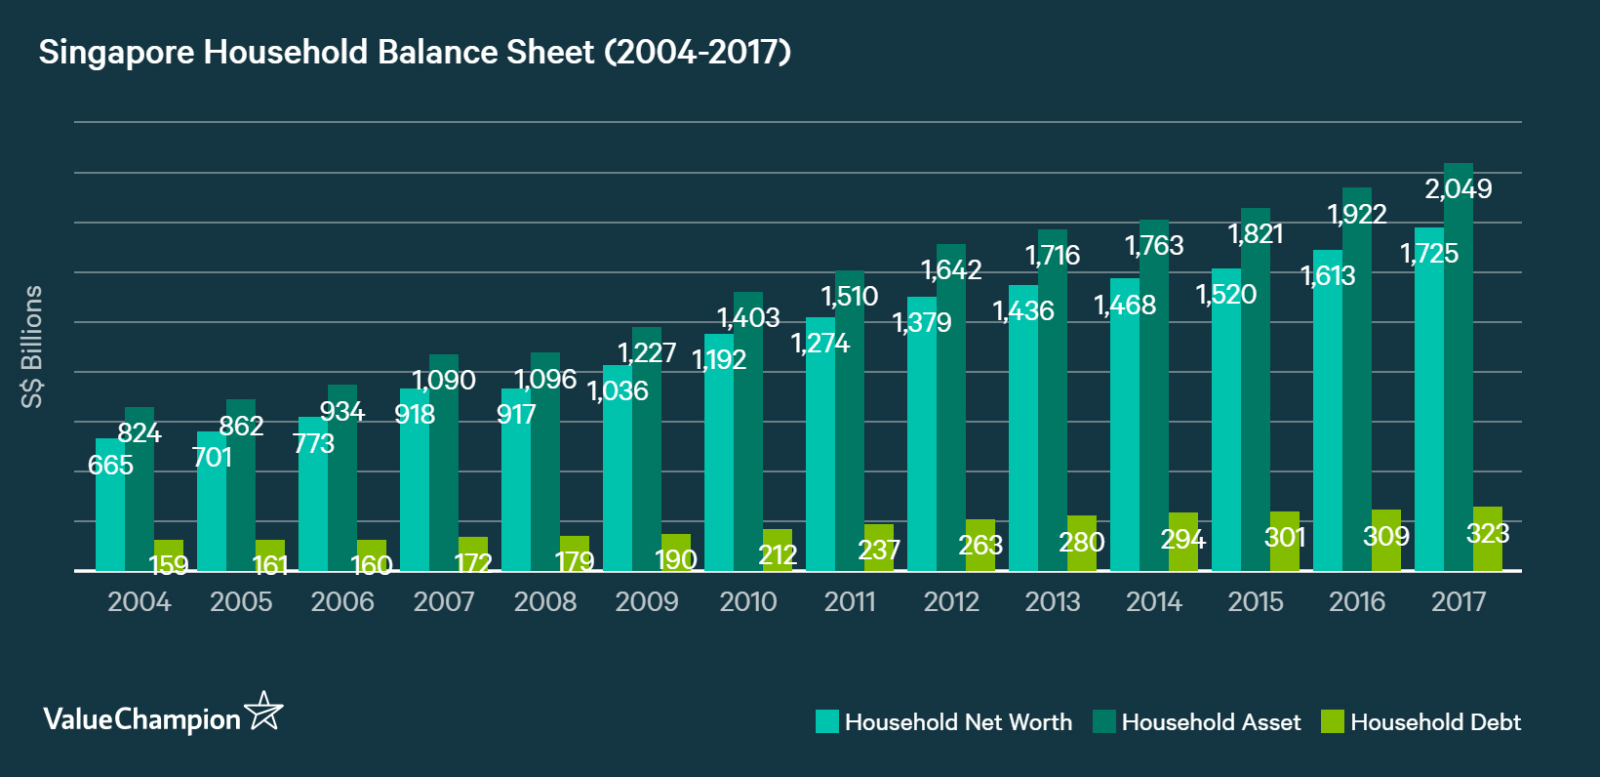
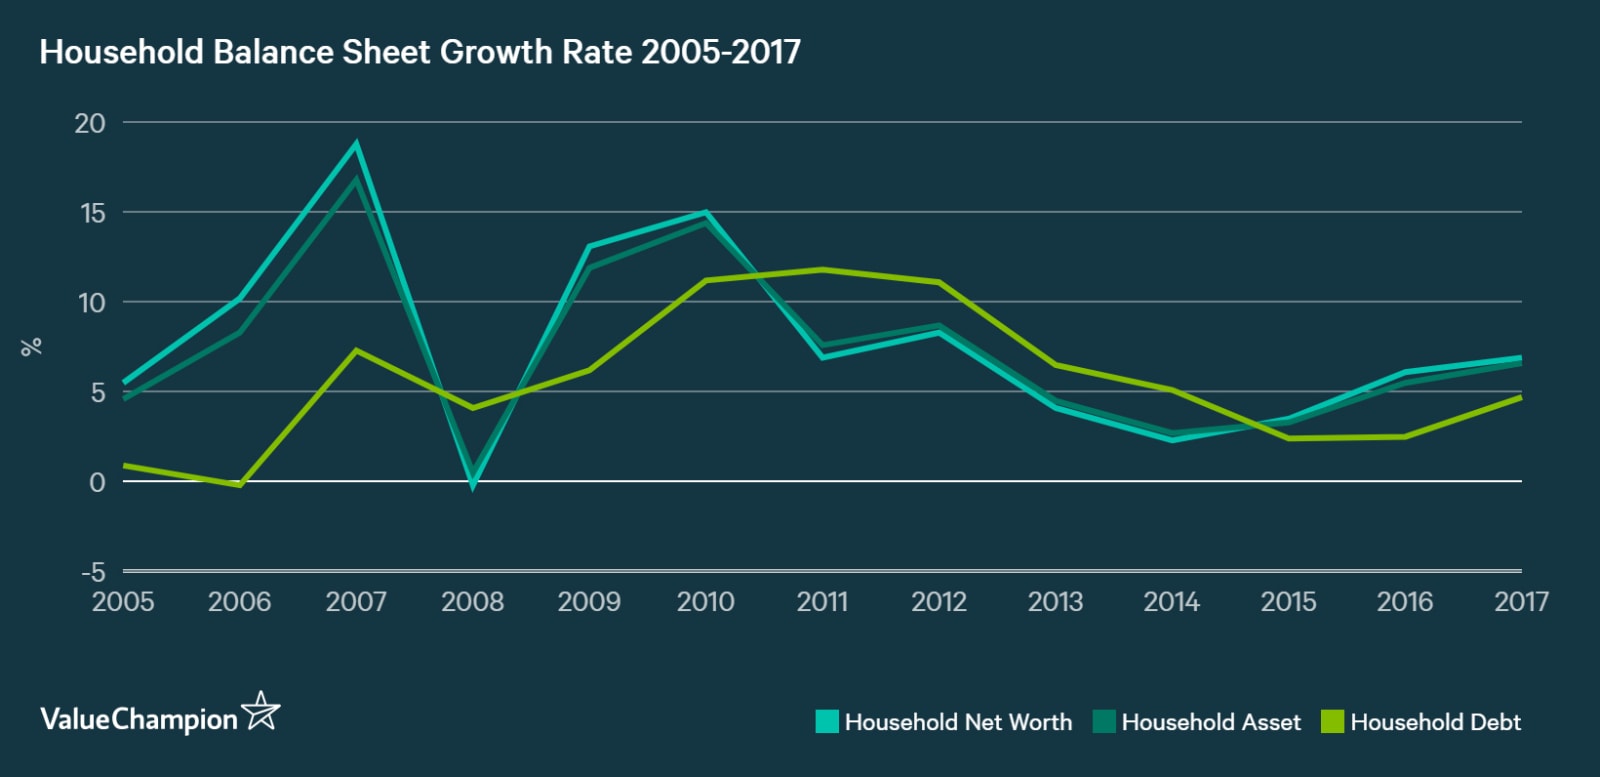
In total, household debt has been increasing at a slightly faster pace than their assets. While its growth rate has declined significantly from its 9% per year growth from 2009 to 2014, but it has accelerated growth again in 2017. Despite the slight acceleration in debt growth, household balance sheet remained in a good shape as its assets and net worth (asset – liability) grew at an even faster rate.
Average Home Loans Per Capita in Singapore
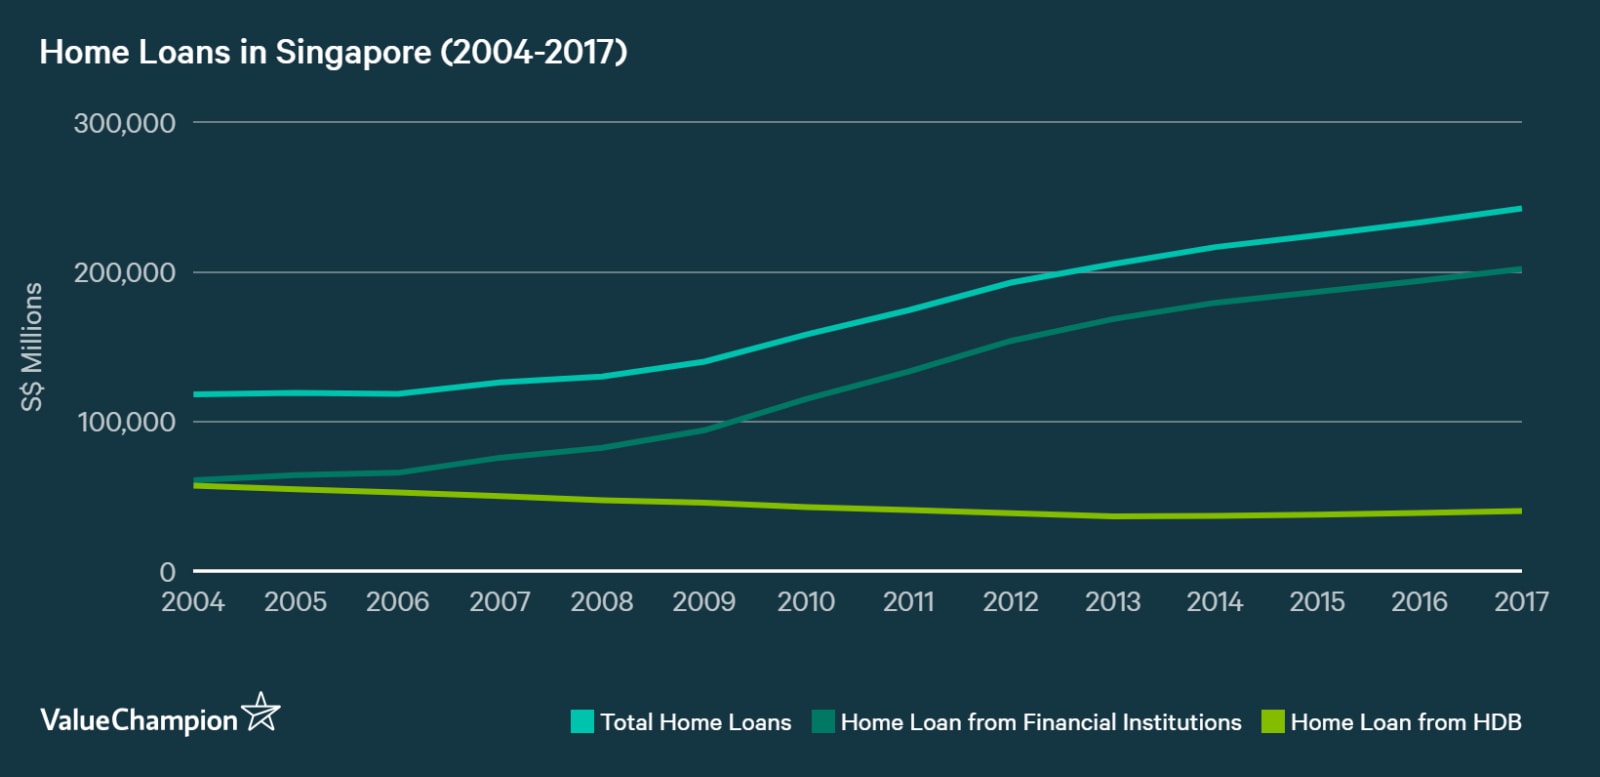
Average home loans per capita was about S$43,220 per capita, representing about 75% of the total. The total outstanding mortgage loans in Singapore was about S$384,9bn as of March 2022, which is a slight drop from December 2021. Interestingly, home loan from HDB actually shrank as a percentage of total home loans, from +30% before 2009 to only about 17% in the recent years. This is likely due to the government’s efforts to curb housing price inflation by limiting government funding for purchasing homes. In fact, HDB loan has been declining by about 2% per year since 2009. However, banks have clearly picked up the slack, evidenced by 10% per year growth of home loans from financial institutions since 2009.
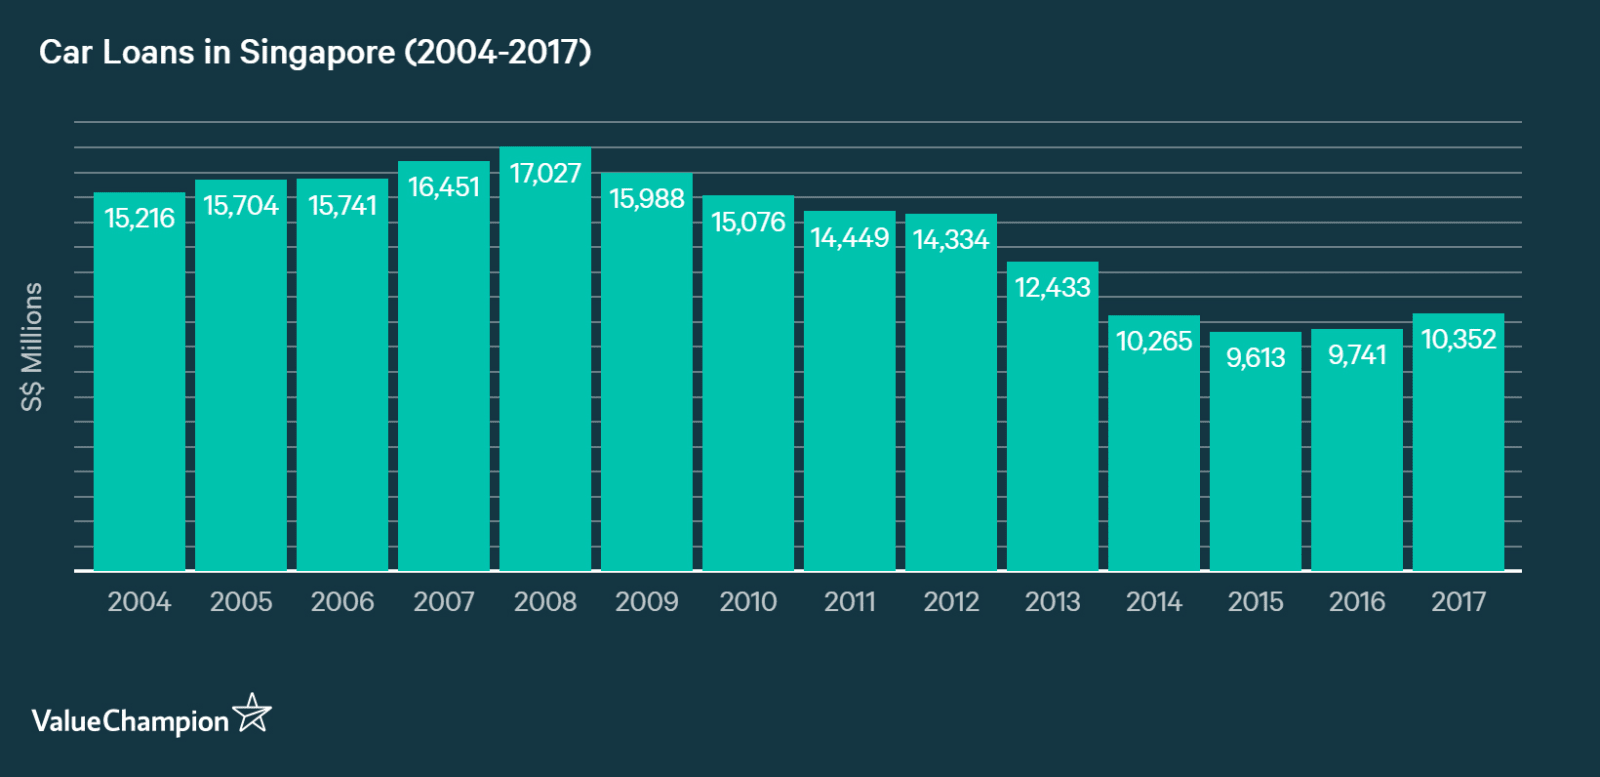
Average Car Loans Per Capita in Singapore
Average car loan per capita in Singapore was about S$1,845 as of 31 Dec 2017, representing about 3% of the total household debt. Perhaps because of the extremely high car prices in the country, auto loans have not been that popular to the locals. Overall amount of outstanding auto loans has in fact declined to S$10.4bn, roughly -5% per year of decrease since 2009. However, outstanding car loans have begun to grow again starting in 2016.
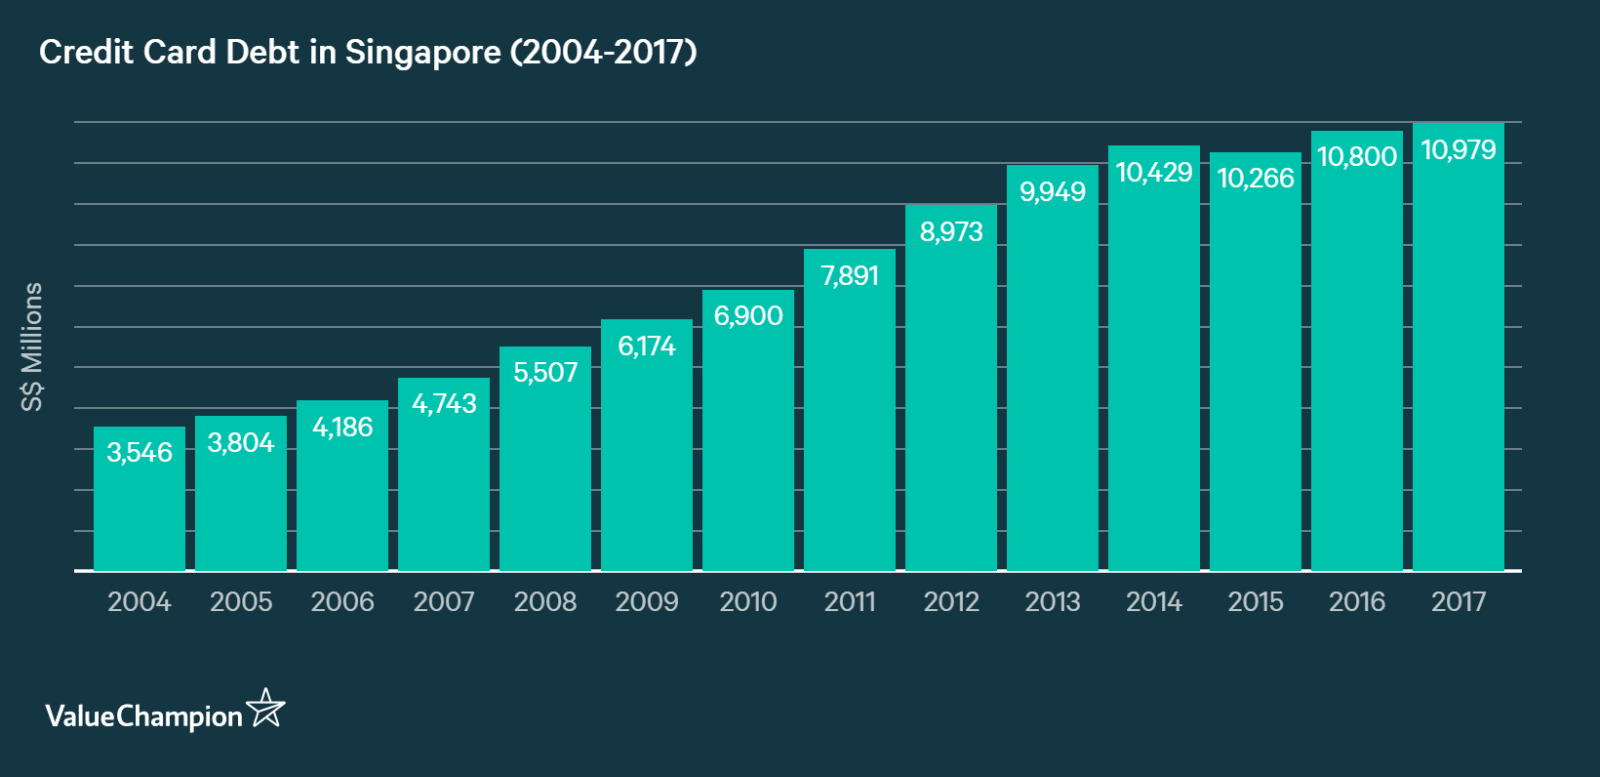
Average Credit Card Debt Per Capita in Singapore
The mean credit card debt of Singaporean households is approximately S$1,956, according to the latest data from the Department of Statistics of Singapore. This captures the ending credit card balance that remained unpaid at the end of the month, instead of the "true" debt amount that had been rolled over from the previous month. This information comes from data collected from 1995 up to 31 Dec 2017.
Credit card debt actually has been one of the fastest growing categories of consumer debt in Singapore. From 2009, credit card & charge card debt has been growing at about 8% per annum basis, compared to 7% for the entire household debt. This trend was more pronounced until 2014, when credit card debt had been growing by 11.1% per annum since 2009. In recent years, card debt growth has slowed meaningfully.
However, the above figures somewhat exaggerate the level of indebtedness on credit cards. Because the data from Department of Statistics measures the outstanding balance at the end of the month, it includes credit card balance that will be paid off before the end of their billing cycles. In order to adjust for this, we analyzed data from Monetary Authority of Singapore, which reports “rolled over” balance of credit cards. Rolled over credit card balance is a more accurate representation of how much credit card “debt” exists in the system.
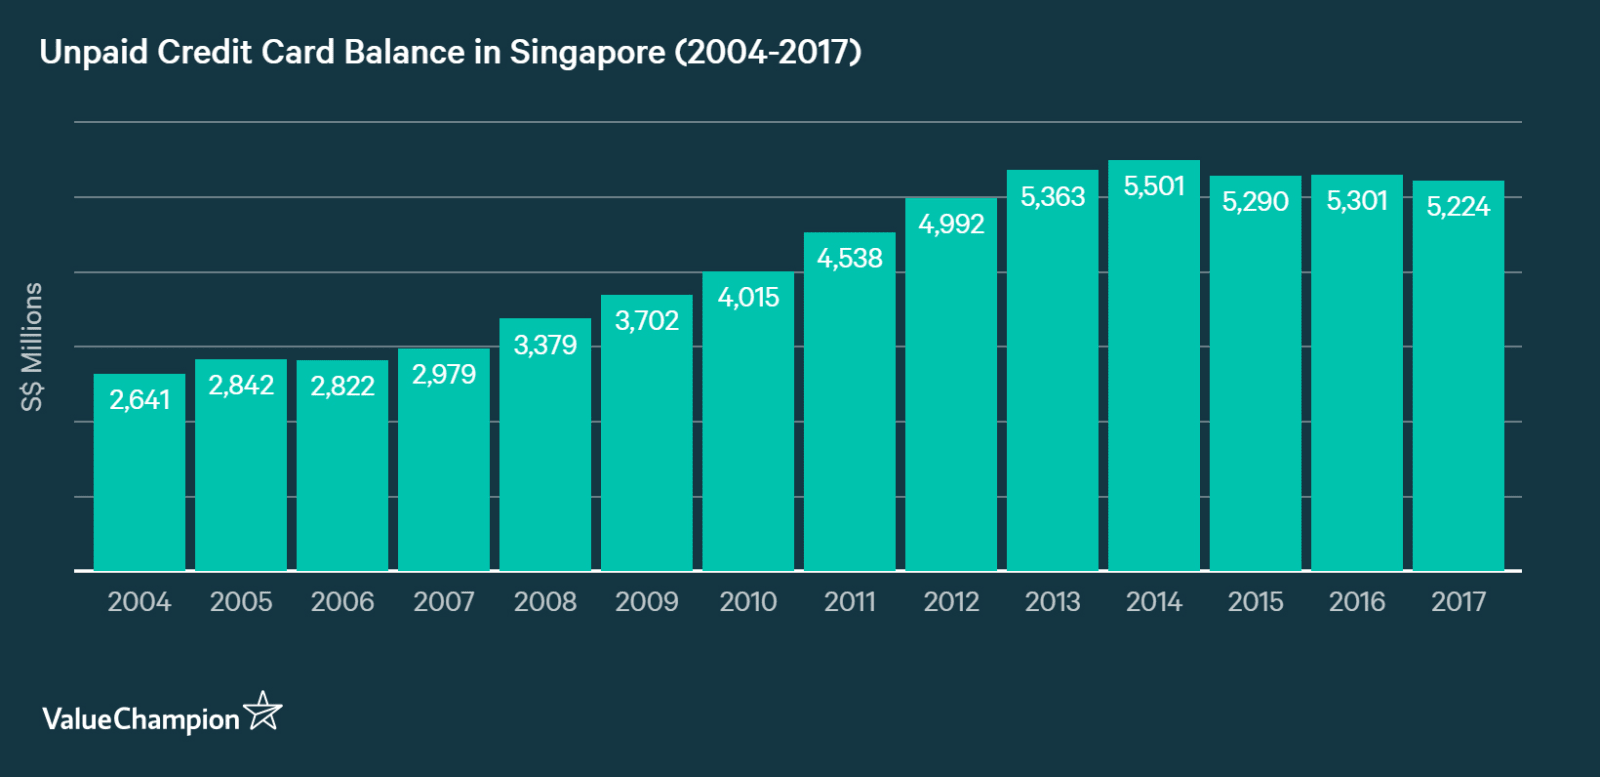
According to this figure, average credit card debt per capita (i.e. amount that could not be paid off right away) was about S$932. While this may sound high to some people, Singapore’s credit card debt situation is not as acute as it is in other developed countries. For instance, credit card debt per capita is over $1,000 in countries like Korea and Australia, while it can be up to $2,000 or more in Hong Kong and the US.
| Country | Credit Card Debt ($ bn) | CC Debt per Capita ($) | CC Debt per Card ($) |
|---|---|---|---|
| Taiwan | $3.4 | $130 | $86 |
| Singapore | $5.2 | $933 | $573 |
| Japan | $92.6 | $729 | $356 |
| Australia | $24.5 | $1,062 | $1,495 |
| Korea | $60.0 | $1,200 | $522 |
| HK | $14.5 | $1,980 | $779 |
| US | $885.0 | $2,603 | $843 |
| UK | $85.8 | $1,340 | $1,430 |
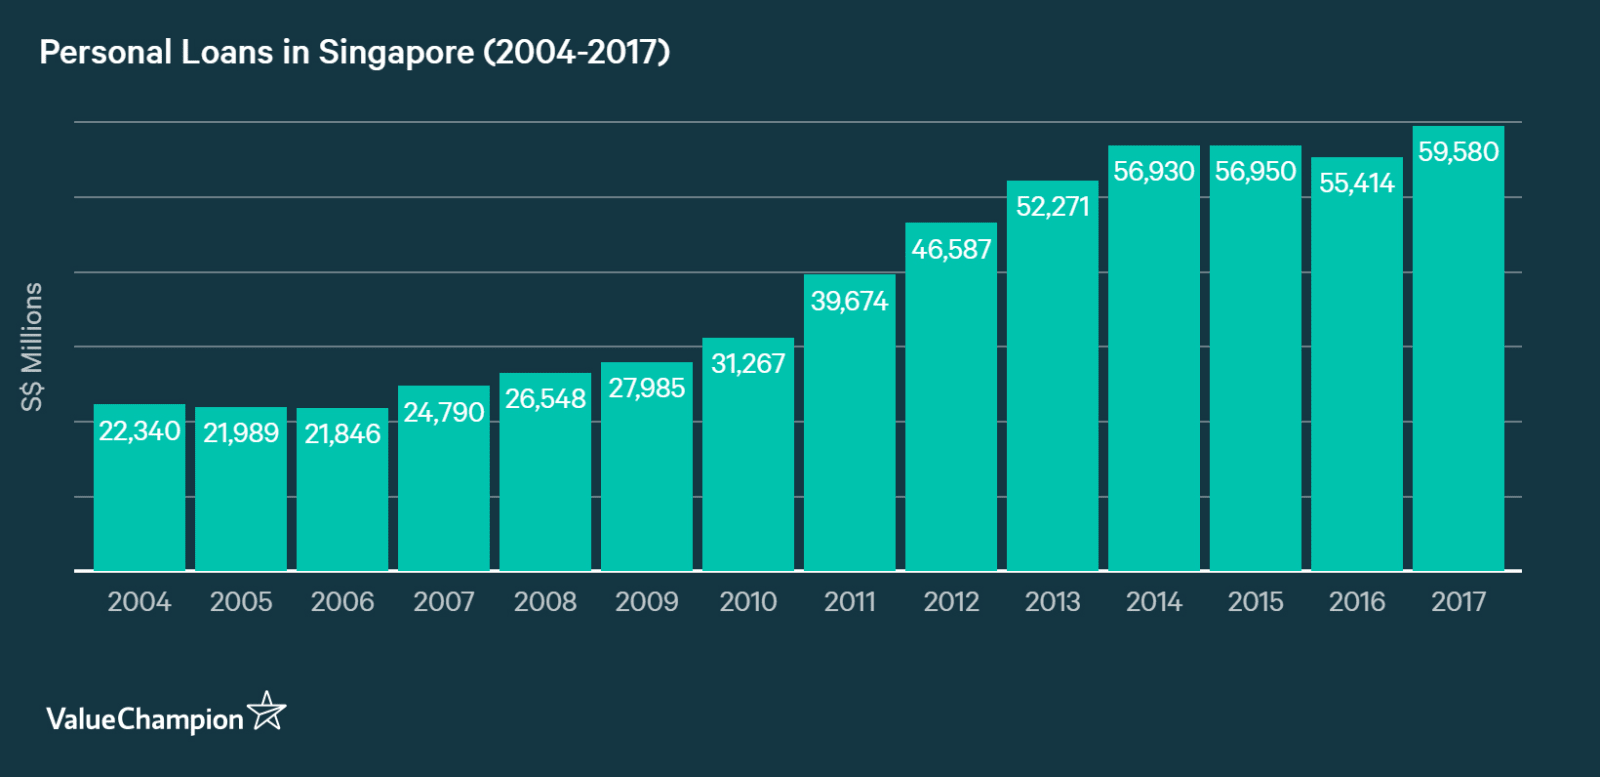
Average Personal Loans Per Capita in Singapore
Average personal loan per capita in Singapore was roughly $10,616 as of 31 Dec 2017. This figure includes loans like personal instalment loans, home renovation loans, education loans and pawn shop loans. Somewhat like credit cards, personal loans have been a popular way of financing one’s needs in the recent years. Before 2009, this category of loans only comprised about 15% of a household’s liability. By 2017, its proportion has increased to more than 18%. It has been the fastest growing category of loans in Singapore, with an annual growth rate of 10% from 2009 to 2017. This may be a bad signal that hints at weak consumer purchasing power, especially when it comes to important but pricey things like college tuition or wedding costs.
Comparison with Other Countries
While household debt has been growing at an alarming rate since 2009, trends have been more or less stabilizing since 2015. Part of this is due to weak economy which is creating less opportunities for consumers to invest into (i.e. homes or small businesses). What’s also a legitimate cause for concern is that, despite stabilization of overall debt growth, consumers are growing increasingly reliant on alternative sources of financing like personal loans, which typically come at relatively high interest rates. This could signal that household income growth is not sufficient to fund increasing cost of living in the country.
On the other hand, the situation in Singapore does not seem so bad when seen side to side with other countries. Below, we show household debt per capita, household leverage (asset/equity), and household debt as a percentage of GDP for Singapore, Korea and the US. As you can see, Singapore households' indebtedness is more or less in line with the other two countries. However, it is important to note that both Korea and the US have also been experiencing lagging consumer income growth & increasing reliance on debt. These are certainly worrying signs for the economy.
| As of 2016 | Singapore | Korea | US |
|---|---|---|---|
| Household Debt per Capita (local Currency) | SGD55,112 | KRW25,606,222 | $46,031 |
| Household Debt per Capita ($) | $38,131 | $21,499 | $46,031 |
| Household Asset/Equity Ratio | 119% | 83% | 89% |
| Household Debt to GDP Ratio | 61% | 90% | 80% |
Read More:

Duckju (DJ) is the founder and CEO of ValueChampion. He covers the financial services industry, consumer finance products, budgeting and investing. He previously worked at hedge funds such as Tiger Asia and Cadian Capital. He graduated from Yale University with a Bachelor of Arts degree in Economics with honors, Magna Cum Laude. His work has been featured on major international media such as CNBC, Bloomberg, CNN, the Straits Times, Today and more.