Top 5 Greenest Countries in Asia-Pacific

Human impacts have caused detrimental impacts to the natural environment around the globe. For example, in some places, excessive air and water pollution, deforestation and climate change have significantly altered the quality of life. To gauge how environmental impact and the state of the natural environment varies from country to country, we've analysed publicly available data to rank the countries of Asia-Pacific. The top countries in our ranking system generate relatively less pollution, greenhouse gasses and plastic waste, while also adopting renewable energy technologies, preserving green spaces and promoting public transportation.
1. Japan
Japan topped our list due to its great ranks across the seven categories we analysed. In particular, Japan's reliable public transportation, clean water and efficient energy industry boosted its rankings. For example, the World Economic Forum (WEF) gave Japan the highest score for train services among countries in our study, while the WEF also reports that just 2.3% of the population is exposed to unsafe drinking water. Furthermore, Japan ranked 4th in Asia-Pacific in terms of both renewable energy and grid efficiency.
| Category | Rank |
|---|---|
| Energy | 1st |
| Air | 3rd |
| Water | 2nd (tie) |
| Greenhouse Gases | 9th |
| Waste | 9th |
| Green Space | 3rd (tie) |
| Transport | 1st |
| Average Rank | 4.0 |
2. Singapore
According to our analysis, Singapore is Asia-Pacific's second greenest country. The country performed well due to low water and air pollution levels and efficient energy and transportation systems. For instance, Singapore has the most efficient electric grid in terms of transmission and distribution losses (just 1.8% of total electric power produced). It also ranked in the top 5 countries in terms of air and water pollution measures. One area for improvement would be Singapore's low reliance on renewable energy in terms of its total energy production (1.8% of total).
| Category | Rank |
|---|---|
| Energy | 3rd (tie) |
| Air | 5th |
| Water | 2nd (tie) |
| Greenhouse Gases | 6th |
| Waste | 10th |
| Green Space | 7th (tie) |
| Transport | 4th |
| Average Rank | 5.3 |
3. Australia & South Korea (Tie)
Australia and South Korea tied for third on our list of greenest countries in Asia-Pacific. Australia's strong rank was driven by its top rank for both the air and water pollution categories. South Korea's score was strong due to its low water pollution, significant green space (63.4% of the country is forested) and efficient train system. While these countries are clearly leaders of positive environmental impact in the region, both could do more to reduce their greenhouse gas emissions – Australia and Korea ranked 13th and 12th for this category, respectively.
| Category | Australia | Korea |
|---|---|---|
| Energy | 2nd | 5th |
| Air | 1st (tie) | 8th |
| Water | 1st | 2nd (tie) |
| Greenhouse Gases | 13th | 12th |
| Waste | 5th (tie) | 5th (tie) |
| Green Space | 7th (tie) | 3rd (tie) |
| Transport | 9th | 3rd |
| Average Rank | 5.4 | 5.4 |
5. New Zealand
Our research found that New Zealand is the 5th greenest country in Asia-Pacific. The country is a leader in a number of categories, including both air quality, renewable energy and green space. For example, it's capital, Wellington, had the lowest average PM 2.5 concentration (6 µg/m³) of any capital in our study in 2018. Additionally, the country leads the way with 24.6% renewable energy production. However, New Zealand would do well to reduce its consumption of plastic – the country averaged the second most daily plastic waste per capita (0.3 kg) of those in our study.
| Category | Rank |
|---|---|
| Energy | 3rd (tie) |
| Air | 1st (tie) |
| Water | 5th |
| Greenhouse Gases | 7th |
| Waste | 12th |
| Green Space | 1st |
| Transport | 10th |
| Average Rank | 5.6 |
Discussion of Categories
In order to assess how "green" each country is, we chose 7 categories that help characterise the environmental impact of each country. These categories include energy, water and air pollution, greenhouse gas (GHG) emissions, waste, forest and green spaces and public transport. We believe that these factors present a picture of how each country contributes to the natural environment.
Asia-Pacific's Greenest Countries - Overall Rankings
| Country | Energy | Air | Water | GHG | Waste | Green Space | Transport | Overall Rank |
|---|---|---|---|---|---|---|---|---|
| Japan | 1 | 3 | 2 | 9 | 9 | 3 | 1 | 1 |
| Singapore | 3 | 5 | 2 | 6 | 10 | 7 | 4 | 2 |
| Australia | 2 | 1 | 1 | 13 | 5 | 7 | 9 | 3 (tie) |
| South Korea | 5 | 8 | 2 | 12 | 5 | 3 | 3 | 3 (tie) |
| New Zealand | 3 | 1 | 5 | 7 | 12 | 1 | 10 | 5 |
| Hong Kong | 9 | 7 | 6 | 3 | 13 | 5 | 2 | 6 |
| Philippines | 5 | 4 | 11 | 1 | 3 | 12 | 13 | 7 |
| Malaysia | 10 | 6 | 7 | 10 | 11 | 2 | 5 | 8 |
| Indonesia | 12 | 11 | 10 | 2 | 2 | 11 | 6 | 9 |
| China | 5 | 11 | 8 | 11 | 7 | 9 | 7 | 10 (tie) |
| India | 11 | 13 | 13 | 4 | 1 | 9 | 7 | 10 (tie) |
| Vietnam | 13 | 10 | 9 | 8 | 4 | 5 | 11 | 12 |
| Thailand | 8 | 9 | 12 | 5 | 8 | 12 | 12 | 13 |
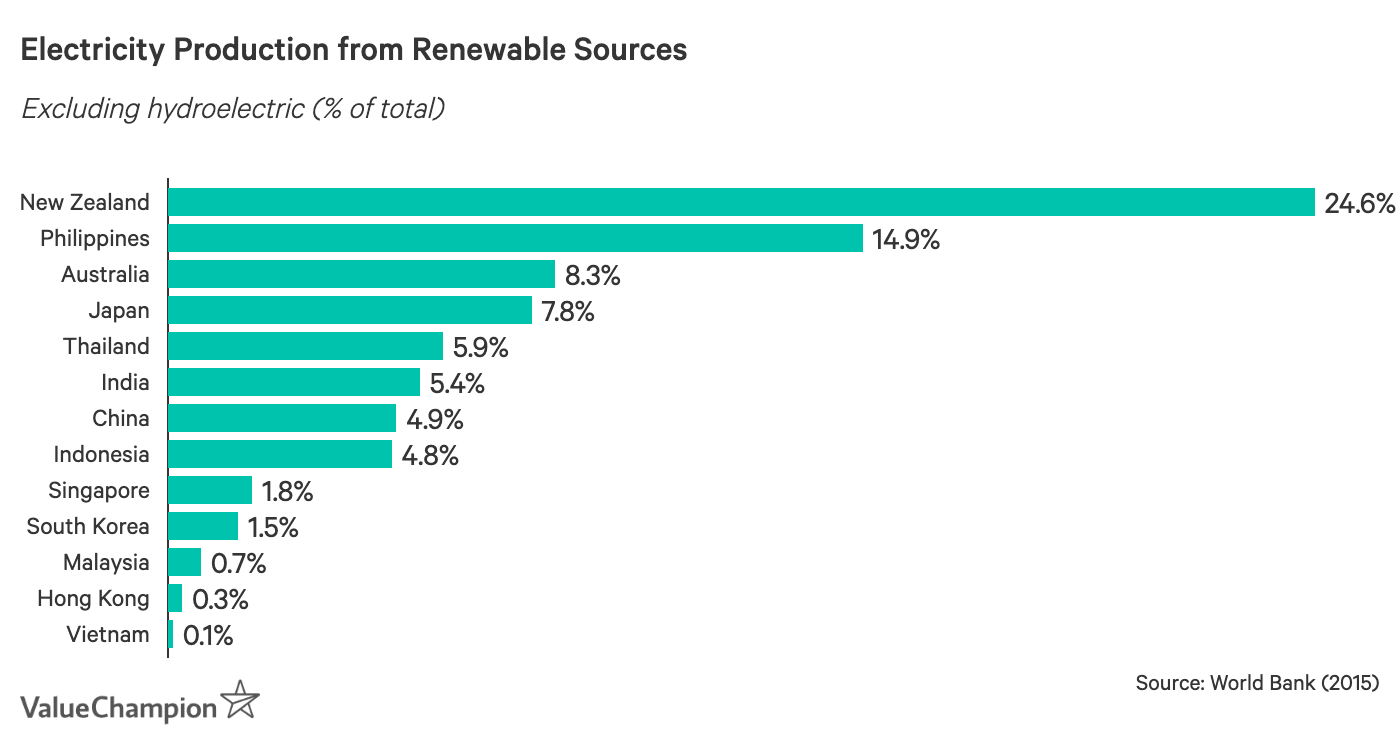
Energy
For the energy category, we ranked these countries by their electricity production from renewable sources (excluding hydroelectric) as a percentage of total energy production and electric power transmission and distribution losses as a percentage of total output. These measures help us understand the country's adoption of clean energy as well as the relative efficiency of each country's electricity system. We chose to use the measure of renewable energy that excluded hydroelectric energy production as larger dams are reported to have life-cycle emissions factors that are closer to those of fossil fuel-based energy sources, rather than other types of renewable energy. Furthermore, hydroelectric dams are known to have significant environmental impacts on their surrounding ecosystems.
Air Pollution
To measure air pollution, we looked at the average particulate matter (PM 2.5) concentration in 2018 by country and by capital city. This allowed us to compare each country's average air quality as well as its air quality in an urban setting. This measure is important as high levels of PM 2.5 (tiny particles in the air) can cause haze as well as a range of negative health impacts.
| Country | Country | Capital City |
|---|---|---|
| Australia | 6.8 | 7.6 |
| New Zealand | 7.7 | 6 |
| Japan | 12 | 13.1 |
| Philippines | 14.6 | 14.3 |
| Singapore | 14.8 | 14.8 |
| Malaysia | 18 | 19.3 |
| Hong Kong | 20.2 | 20.2 |
| South Korea | 24 | 23.3 |
| Thailand | 26.4 | 25.2 |
| Vietnam | 32.9 | 40.8 |
| China | 41.2 | 50.9 |
| Indonesia | 42 | 45.3 |
| India | 72.5 | 113.5 |
| * Source: IQAir AirVisual 2018 World Air Quality Report | ||
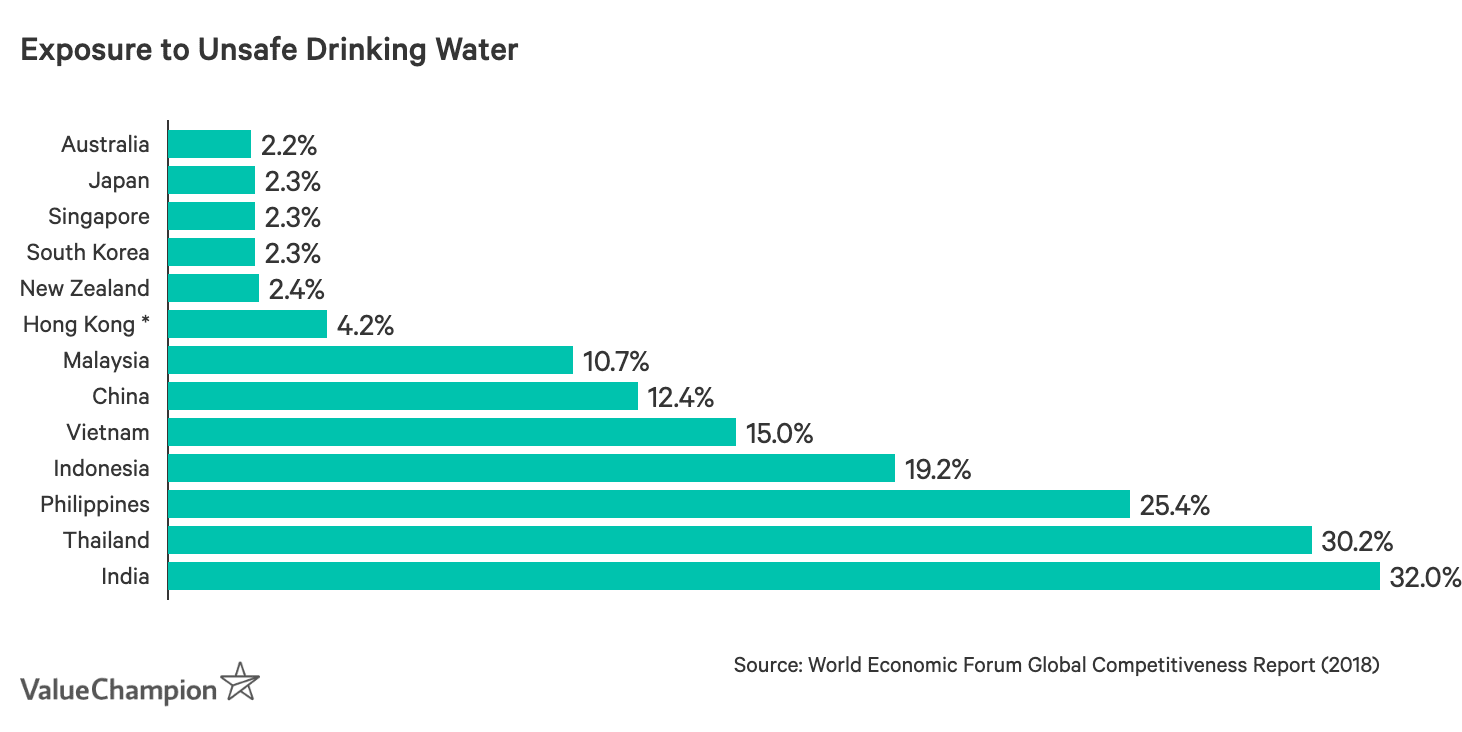
Water Pollution
In order to understand the relative water pollution by country, we looked at the prevalence of unsafe drinking water in each country on our list. This measure provides a proxy for water pollution as it relates directly to human health. The World Economic Forum provides both a score and an estimate of the percentage of the population that is exposed to unsafe drinking water. Please note that Hong Kong was given a score, but not a percentage estimate. We ran a simple regression in order to predict the percentage of Hong Kong's population that is exposed to unsafe drinking water.
Greenhouse Gas Emissions
Greenhouse gases trap heat in the earth's atmosphere and can accelerate climate change. We used carbon dioxide (CO2) (a common GHG) as a measure for each countries contribution to climate change. We used 2 statistics that use carbon emissions to help balance the rankings between very populous and very rich countries: CO2 emissions in metric tons per capita and CO2 emissions per unit of GDP.
| Country | CO2 emissions (metric tons per capita) | CO2 emissions per unit of GDP (PPP)* (kg/CO2/2010 USD) |
|---|---|---|
| Philippines | 1.10 | 0.16 |
| India | 1.70 | 0.26 |
| Indonesia | 1.80 | 0.17 |
| Vietnam | 1.80 | 0.35 |
| Thailand | 4.60 | 0.23 |
| Hong Kong | 6.40 | 0.11 |
| China | 7.50 | 0.47 |
| New Zealand | 7.70 | 0.19 |
| Malaysia | 8.00 | 0.28 |
| Japan | 9.50 | 0.24 |
| Singapore | 10.30 | 0.10 |
| South Korea | 11.60 | 0.33 |
| Australia | 15.40 | 0.35 |
| * Sources: World Bank (2014), IEA (2016) | ||
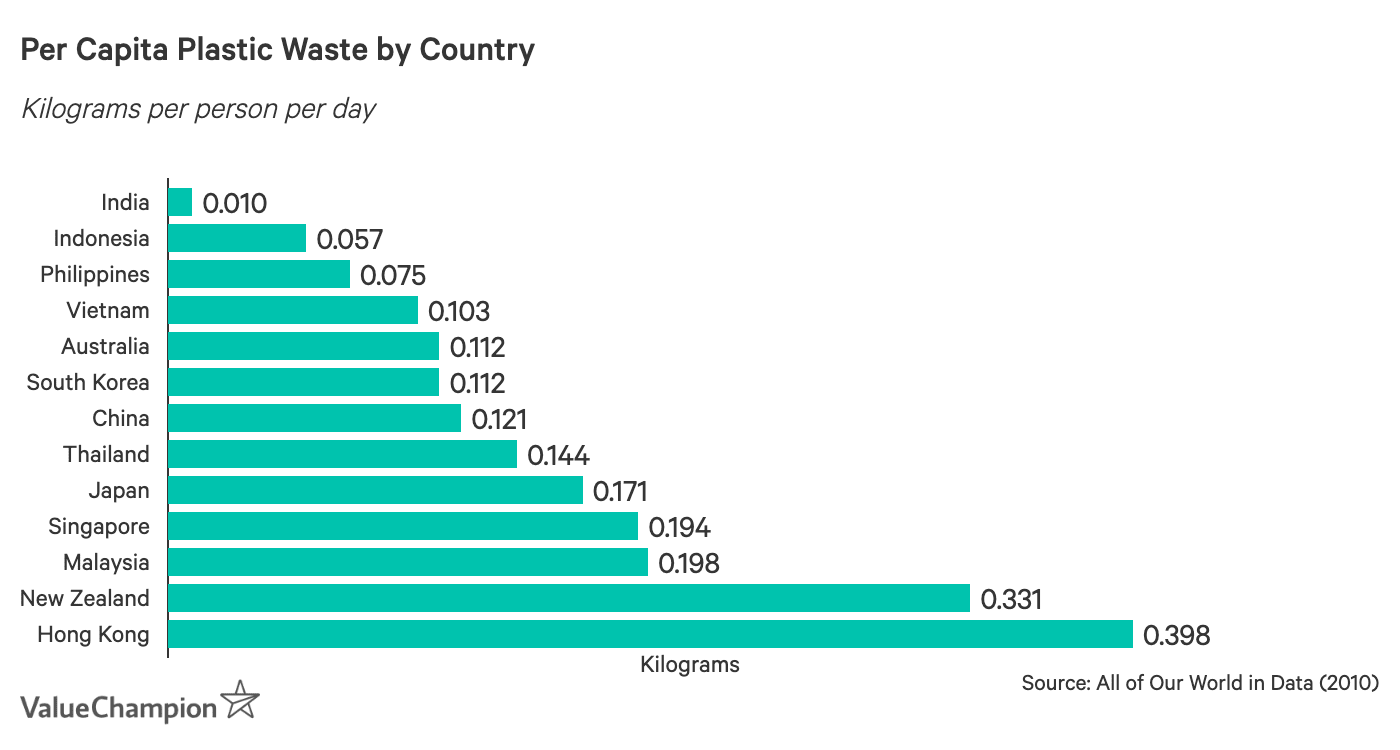
Waste
In terms of waste, we used kilograms of plastic waste per person per day to rank these countries. Plastic is a very relevant type of waste as it is increasingly generated around the world and is harmful to a variety of ecosystems. Unfortunately, recycling data was not collected in a comparable manner in all of the countries on our list. That being said, plastic waste generation is the root of the problem, making it an important data point.
Green Space
Our green space category covers two measures that are both environmentally beneficial as well as helpful for quality of life. We looked at forested area within each country as well as square meters of green space per person in each country's most populous city. First, forested areas are important as they can capture harmful greenhouse gases such as carbon dioxide. Green spaces in cities are environmentally beneficial for a number of environmental reasons and also make cities more livable and appealing to residents. They also may represent the country's efforts in preserving green space.
| Country | Forest area (% of land area) | Green spaces per person (m2/person) |
|---|---|---|
| Japan | 68.5 | 10.6 |
| Malaysia | 67.6 | 43.9 |
| South Korea | 63.4 | 23.4 |
| Indonesia | 49.9 | 2.3 |
| Vietnam | 48.1 | 11.2 |
| New Zealand | 38.6 | 207.0 |
| Thailand | 32.2 | 3.3 |
| Philippines | 27.8 | 4.5 |
| India | 23.8 | 41.0 |
| Singapore | 23.1 | 66.2 |
| Hong Kong | 23.0 | 105.3 |
| China | 22.4 | 88.4 |
| Australia | 16.3 | 116.5 |
| * Sources: World Bank (2016), Siemens Green City Index (2012), others (see table below) | ||
Transport
Finally, we compared the public transportation systems of each country. This is a way to understand how realistic it is for residents of each country to travel in a more environmentally friendly manner, compared to driving their own car. To compare public transportation systems, we used the World Economic Forum's (WEF) "Effectiveness of Train Services" score as a proxy.
| Country | Effectiveness of Train Services (1-7) |
|---|---|
| Japan | 6.6 |
| Hong Kong | 6.4 |
| South Korea | 5.9 |
| Singapore | 5.8 |
| Malaysia | 5.2 |
| Indonesia | 4.7 |
| China | 4.5 |
| India | 4.5 |
| Australia | 4.3 |
| New Zealand | 3.9 |
| Vietnam | 3.4 |
| Thailand | 2.6 |
| Philippines | 2.4 |
| * Source: World Economic Forum Global Competitiveness Report (2018) | |
Methodology & Sources
After gathering data for each category, we averaged the rank of each statistic to generate each country's rank for each category. We used the average rank for the seven categories to determine the overall rankings. Therefore, weighted each category evenly.
There are several limitations to our analysis. First, environmental impact is an incredibly complex issue and is difficult to analyse in a simple manner. For this reason, our analysis is not comprehensive and is intended to inform public policy. Instead, we believe that the categories and "big picture" statistics give a relatively accurate characterisation of the human impact and state of the environment in each country. Another caveat to our analysis is that there was not sufficient data for all of the countries in the region. For this reason, we focused on the top performers in the area (as those that are achieving the most environmentally), rather than highlighting those at the bottom of the list. Put another way, countries at the bottom of the list should necessarily be regarded as the least green in Asia-Pacific. Finally, while we always used the most updated data, some statistics may have changed since they were last publicly reported. For a full list of our sources, please refer to the table below.
| Data | Source(s) |
|---|---|
| Electricity production from renewable sources, excluding hydroelectric (% of total) | World Bank (2015) |
| Electric power transmission and distribution losses % output | World Economic Forum Global Competitiveness Report (2018) |
| Average PM2.5 concentration (µg/m³) | IQAir AirVisual (2018), Malaysia/Kuala Lumpur: World Bank (2016), Berkeley Earth (2018) |
| CO2 emissions (metric tons per capita) | World Bank (2014) |
| CO2 emissions per unit of GDP (PPP)* (kg/CO2/2010 USD) | The International Energy Agency (2016) |
| Per capita plastic waste (kilograms per person per day) | All of Our World in Data (2010) |
| Forest area (% of land area) | World Bank (2016), BBC (2016) |
| Green spaces per person (m2/person) | Green City Index Siemens (2012), Australia State of the Environment 2016, Improving functional connectivity in Wellington City’s urban ecological network (2011) |
| Effectiveness of Train Services | World Economic Forum Global Competitiveness Report (2018) |