What Do Singapore's Rich Spend Their Money On?

Singapore has over 200,000 millionaires, with over 1,000 of them considered to be ultra high networth individuals worth over S$68.9 million. With films like Crazy Rich Asians giving us an idealised version of high-income spending, imagining the spending habits of the ultra-rich can make the mind wander. While there are plenty of articles about how the rich spend their money, we were interested in the hard figures of their expenditures. Using the most recent Household Expenditure Survey, we analysed the spending of upper-income households to see how they really spend their money.
Key Findings:
- High-income households spend more money on cultural experiences and travel
- Households in the 91st-100th income decile spend the least on children's pocket allowances
- High-income households spend the least on tobacco products
- Despite differences on a granular level, there are many similarities between high-income and mid-income household expenses
What Do High-Income Singaporeans Spend Money On?
Economic theory suggests that as their income increases, consumers will typically start spending more on goods that have a high-income elasticity of demand, such as travel, clothing and luxury items. We see this theory manifested in the spending habits of rich Singaporeans. In fact, we found that the top income households allocate a considerably larger portion of their monthly spending compared to average households on discretionary expenditure. This includes disproportionate spending increases on repairs, clothing and personal care. There is also an increase in spending on experiences, such as travel, entertainment and culture, sports and international education.
Rich Households Spend Money on Experiences
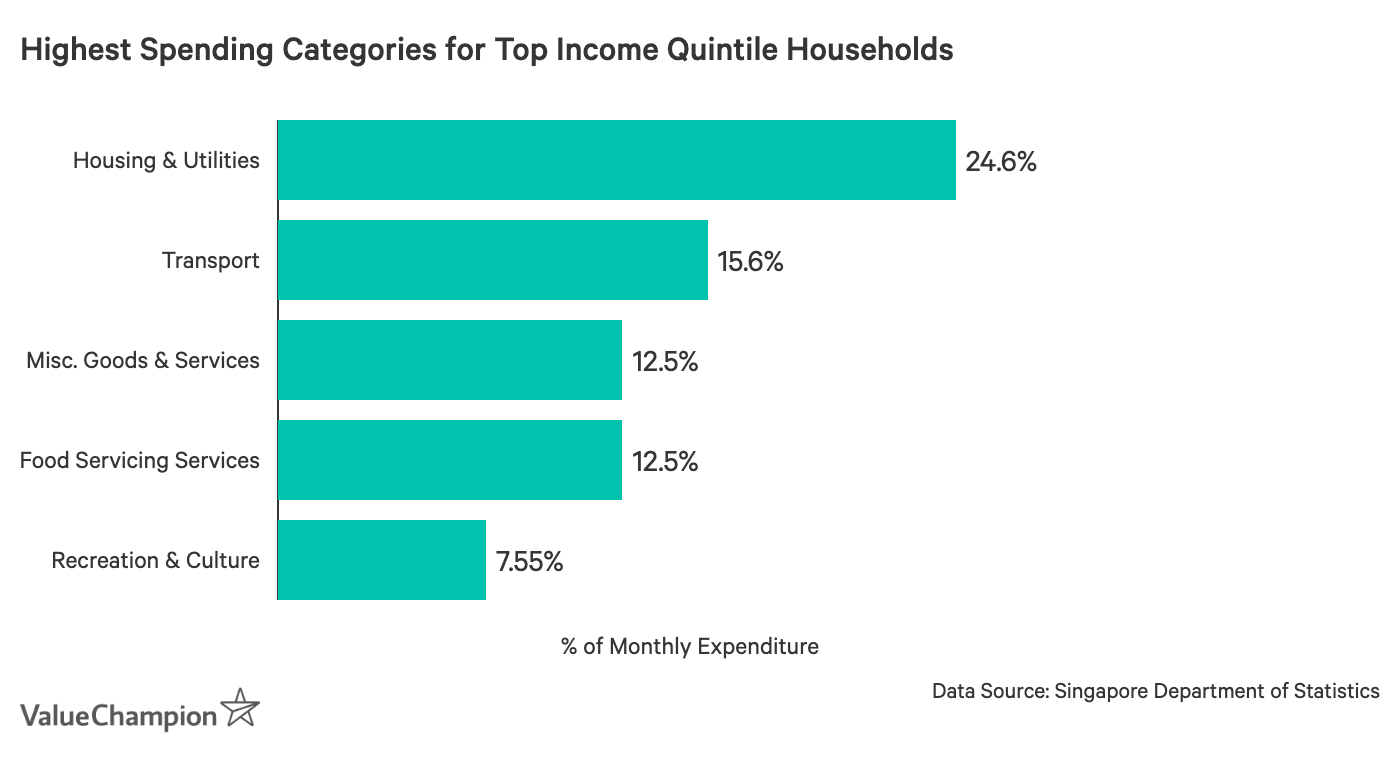
The amount that high-income families spend on experiences may seem to suggest that they value these activities. For instance, the Household Expenditure survey reported that the top income quintile households attribute 7.5% of their monthly expenditure on recreation and culture. Within this category, upper-quintile households spend 3.5x more on concerts, plays and cultural theatre than mid-income households as a proportion of monthly expenditure. Furthermore, they also reported spending an estimated S$157 per household annually on sports, camping and recreational equipment.
High-income households are also the only income group to allocate most of their university expenditure on overseas universities (1.4% of total monthly budget vs. 0.5% of total mid-income household budgets). This preference for overseas education among high-income families suggests that international prestigious universities and international experience are believed to be beneficial in getting a leg-up in the job market.
Upper-Income Households Spend More on Travel
High-income Singaporeans also allocate more of their monthly budget on traveling outside of Asia compared to their mid-income counterparts. Unlike most households where most of the travel budget is dedicated to ASEAN destinations, the top 20% earners spend 1.59% of their monthly budget on package tours and holiday expenses on destinations outside of Asia, compared to the mid-income household expenditure average of 0.7%.
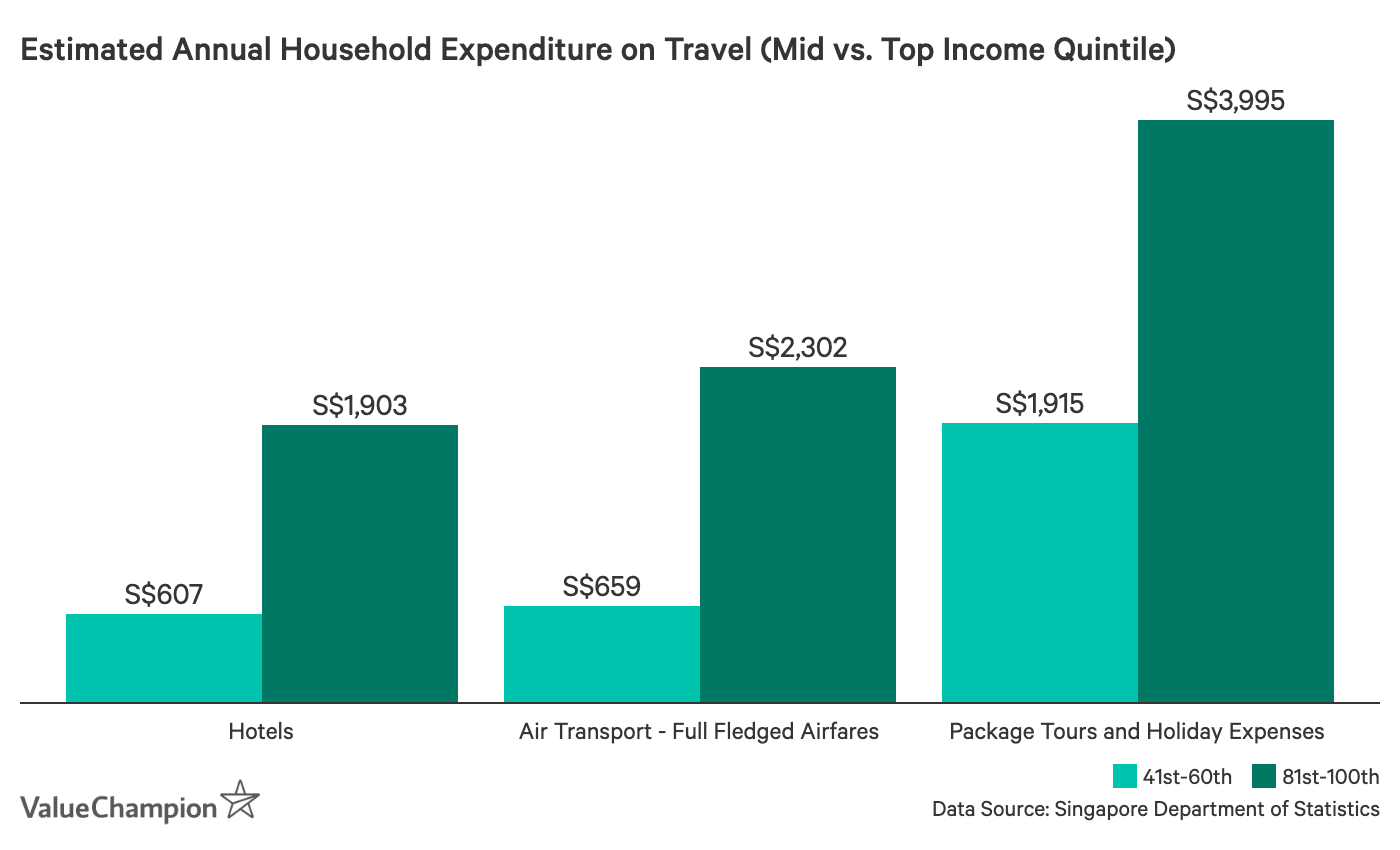
For instance, according to the survey, high-income households spent an estimated S$1,084 per year on travel to Europe in 2018, and they are the only group with a significant amount of their budgets (0.1% of their monthly expenditure) allocated to package tours to African destinations. While it makes sense that richer Singaporeans have more cash on hand to pay for airfare and hotels in far flung destinations, it is nonetheless interesting to see a greater priority placed on farther destinations. This is in line with anecdotal travel trends among high net-worth individuals. For instance, bespoke travel packages focusing are trending with rich Singaporeans, especially if the itinerary includes being taken outside of their typical geographical comfort zones.
High-Income Households Allocate More of Their Budget to Keeping up Appearances
Higher-income Singaporeans also allocate more of their budget to maintaining appearances. This includes maintaining their personal image and keeping their purchases in top shape.
For example, households in the top 20% are the only group to allocate a more than a marginal amount (S$60-S$78 per year) to cleaning, repair and hire of clothing, made-to-measure clothing and car repair. Even more specifically, we found that they allocate three times as much of their monthly budget on laundry compared to mid-income households, indicating either a general increase in the amount of clothing acquired or the need to use specialised services such as dry cleaning. They are also the only group to spend a notable amount of their budget on car repair and maintenance (0.8%). This is unsurprising, considering they spend the most out of any group on cars, which may be expensive and require costly repairs.
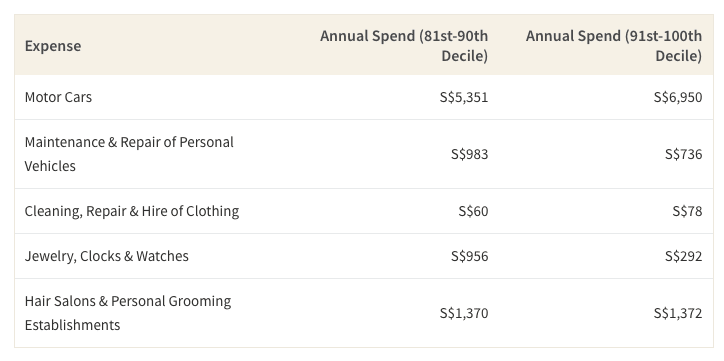
However, when it comes to luxury items such as jewelry or watches, there are some differences in spending habits among the rich. Overall, the top 20% spend 5x more on collectibles including jewellery, clocks and watches—equivalent to S$624 per year—compared to the mid-quintile group. However, when breaking down the quintile, we found that the 91st to 100th income percentile group actually spends 70% less on these items than the households in the 81st to 90th percentile.
Why is this? A recent article that interviewed several high net-worth Singaporeans found that while the high-income Singaporeans do enjoy purchasing luxury items, purchases that promote personal goals and experiences such as travel, investments and philanthropy are gaining more interest. When taking philanthropy as an example, we find that the income earners in the middle-aged age brackets who have the highest incomes are the ones who contribute the most to charity. For instance, the National Volunteer & Philanthropy Centre (NVPC) found that most donations that occurred on Christmas Day in 2018 came from people aged 35-54.
High-Income Households Spend Least on Tobacco, Food & Children's Allowances
We found that the top 20% of earners in Singapore spend the least amount of money on tools and equipment for their homes, tobacco, grocery shopping and children's allowances.
The Richer the Household, The Less Money Spent on Tobacco
While wealthier households do not necessarily shy away from vices (considering they spend more on wine than any other household quintile), we found that there is a drastic decline in tobacco spending as income increases. Compared to an estimated annual expenditure of S$66 on tobacco for households in the upper-income decile, households between the 1st-60th income percentiles annually spend between S$318 and S$492 on tobacco. This drastic decline in tobacco spending suggests that richer Singaporeans may smoke at lower rates than lower and mid-income groups. This is in line with global socioeconomic trends, as countries around the world have similar disparities between income class and smoking rates. For instance, in the United States, while smoking rates decreased as a whole, low-income Americans still smoke at disproportionately greater rates compared to their richer counterparts.
High Earners Spend Less on Groceries & Have Different Food Preferences
We also found that high-income Singaporean households spend 68% less on groceries compared to all other income brackets. When they do grocery shop, they also prefer to buy different foods. For instance, the top 20% of households spend more on beef but less on mutton, poultry and pork than the average household. The top earning households also spend less on fresh vegetables, both by the dollar expenditure and as a proportion of their monthly budget. Additionally, it is interesting to note that the rich have a preference for wine compared to low and middle-income households. In fact, the top 10% spends three times as much as the average household per month on wine (S$16.60).
Monthly Expenditure on Food Items For Mid and High-Income Households
| Expense | 41st-60th Quintile | 81st-100th Quintile |
|---|---|---|
| Bread and Cereals | S$78.00 | S$72.10 |
| Meat | S$67.80 | S$57.00 |
| Fish and Seafood | S$63.50 | S$56.40 |
| Milk, Cheese and Eggs | S$49.50 | S$40.80 |
| Oils and Fats | S$8.40 | S$6.90 |
| Fruits | S$49.20 | S$60.00 |
| Vegetables | S$53.80 | S$47.80 |
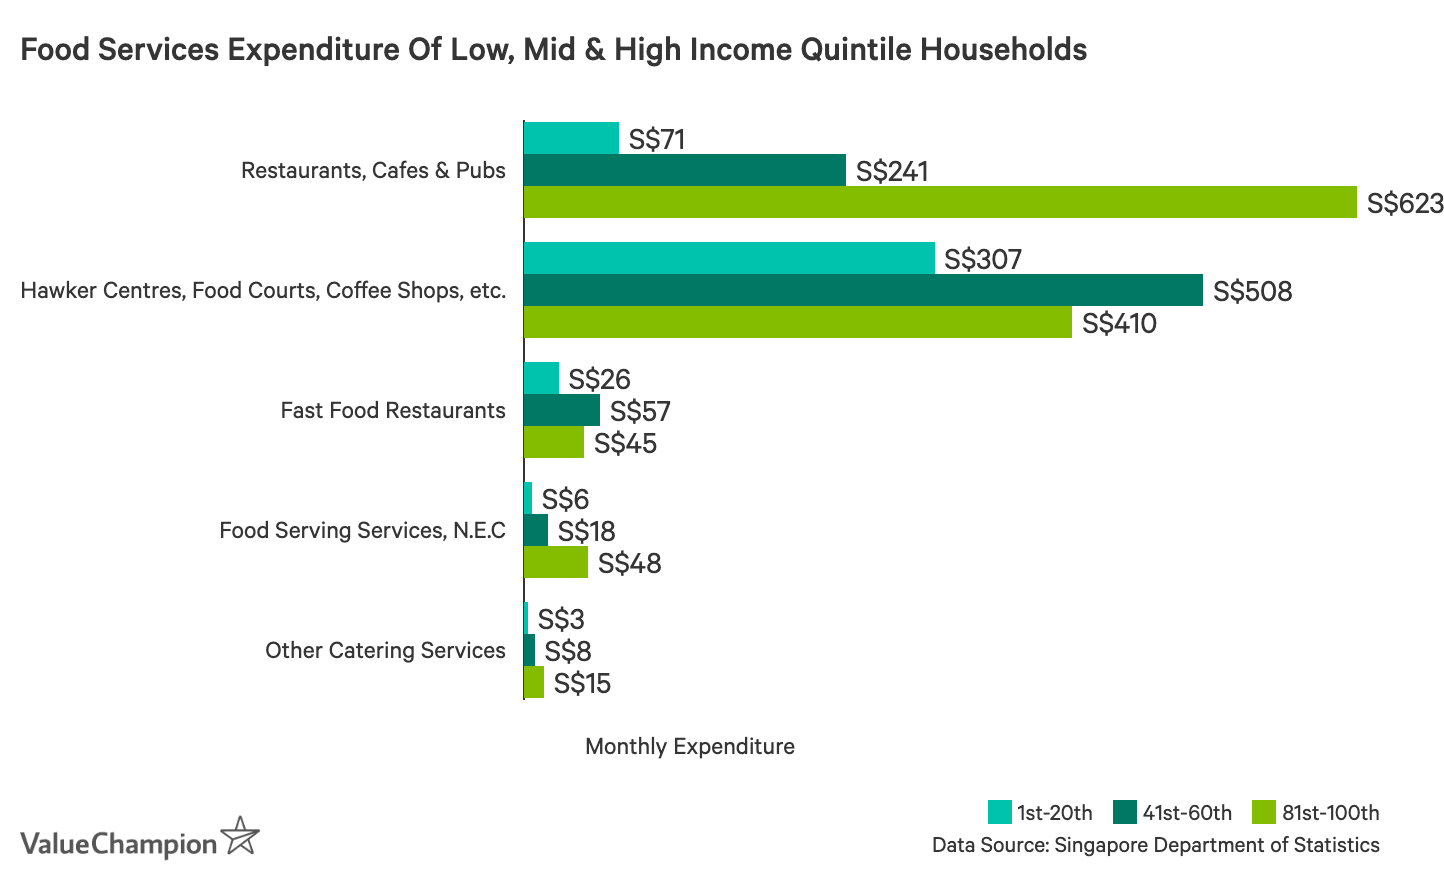
Furthermore, survey data suggests that high-income households spend considerably less money on low-cost dining options. For instance, households in the top 20% spend significantly less money on dining out in coffee shops, canteens and hawker centres. Instead, they prefer restaurants, cafes and pubs. For instance, the top 10% of households allocate 7.4% of their budget to dining out at these establishments—almost equivalent to what the bottom 10% allocate on healthcare alone. There are a few potential explanations for this trend. First, high-income families may lead very busy lives where home cooking takes a backseat. Second, restaurants are typically more expensive than hawker stalls, so the dining out preferences of the rich may make up a larger chunk of their budget.
High-Income Singaporean Households Spend Least on Child Allowances
Interestingly, we found that the top 20% spend the least out of all the income quintiles on child allowances (S$14.20 per month vs. the average S$23 per month). This figure drops even lower when breaking down the quintile—the top 10% only allocates S$11 per month for children's pocket allowances. Initially, we thought that this could be due to the age of high-income earners. As wage earners age and advance in their careers, they may enter the top 20% income quintile only after their children graduate from secondary school and thus no longer need an allowance.
| Income Category | Monthly Allowance Spending | Allowance as % of Budget |
|---|---|---|
| 1st-20th | S$22.20 | 0.9% |
| 41st-60th | S$26.10 | 0.5% |
| 80th-100th | S$14.20 | 0.19% |
However, we found that the majority of head income earners who are earning S$20,000 or more per month are in their 40's and 50's. Considering that the majority of children are born to women between the ages of 25 and 35, this means children of the high earners will be at peak primary and secondary school age where they would be receiving an allowance. However, while the decline in allowance expenditure could be due to several factors, the available data doesn't support any specific hypothesis. It is possible that children of high-income earners don't need to spend money on typical expenses that allowances pay for—like public transportation or school lunches—as they may have free alternatives for both (such as a family car or free/home lunch).
Despite Differences, There Are Many Similarities in Spending
While it may seem like the rich lead lives that are incomparable to the rest of society, their general spending practices show otherwise. Despite differences in discretionary spending, high-income Singaporeans still spend a large chunk of their paycheck on daily necessities and bills.
Top Household Expense Categories Per Income Quintile (as % of Monthly Expenditure)
| Category | 1st - 20th* | 21st - 40th | 41st - 60th | 61st - 80th | 81st - 100th |
|---|---|---|---|---|---|
| Housing & Utilities | 29.7% | 24.5% | 22.1% | 22.2% | 24.6% |
| Transportation | 8.3% | 10.7% | 13.0% | 14.4% | 15.6% |
| Food Serving Services | 12.5% | 14.9% | 14.6% | 14.4% | 12.5% |
| Miscellaneous Goods & Services | 9.1% | 10.4% | 11.4% | 12.2% | 12.5% |
| Data Source: Singapore Department Of Statistics, Household Expenditure Survey 2017/2018 | |||||
For instance, the top three categories where households spend the most money are housing, transportation and food serving services. While we would expect high-income households to have more expensive cars and homes and thus spend more money on these expenses, we may also believe that they are spending a greater percentage of their income to maintain these goods. However, this is only partially true. While the upper-income households do allocate more of their budget to transportation (mainly due to their private cars), they allocate similar percentages of their budget to housing and food services (restaurants, cafes, etc.) as mid-income households.
Methodology
To understand the spending of high-income Singaporean households, we used data from the 2018 Singapore Household Expenditure Survey. In particular, we looked at data that broke down expenses by category and income deciles and quintiles. We were then able to see the dollar amount spent on each expense group, as well as how much of the monthly household budget that expense made up. Since there are many expenses in our daily lives that are not purchased monthly, some of the figures have very small monetary values. However, even these figures are significant in our analysis because they still indicate a clear difference in spending between different income groups—especially when considering spending over the long run.
One thing to take note is that while it may seem like the high-income households may spend more money on certain items, it may not be an indicator of individual spending. Therefore, it is possible that individuals in different income brackets actually spend the same amount of money for certain expenses. Furthermore, it is important to note that people's responsibilities and needs are different at each income level, especially considering different age groups. While it may seem like the upper income spends less money on healthcare compared to low-income groups, a possible explanation could be that on average, they are younger and therefore have less health concerns than lower-income households that are made up of retirees. Thus, while analysing how high-income households spend their money can explain certain trends on a macro level, it may not provide insights to all forms of individual spending in Singapore.

Anastassia is a Senior Research Analyst at ValueChampion Singapore, evaluating insurance products for consumers based on quantitative and qualitative financial analysis. She holds degrees in Economics and International Business Management and her prior working experience includes work in the capital markets sector. Her analyses surrounding insurance, healthcare, international affairs and personal finance has been featured on AsiaOne, Business Insider, DW, Vice, Her World, Asia Insurance Review, the Australian Institute of International Affairs and more.