What Really Drove Singaporean Real Estate Prices Down During COVID-19?

Singapore’s housing market is among some of the most expensive in the world. However, with the outbreak of the Coronavirus, Singapore’s real estate market, which has been strong over the past few years, has experienced considerable turbulence in pricing compared to previous years. But was every neighborhood in Singapore affected similarly by the pandemic? In this study, we’ve analyzed the price per square foot by postal code to examine exactly which Singaporean neighborhoods saw the greatest price changes during the pandemic.
Key Findings
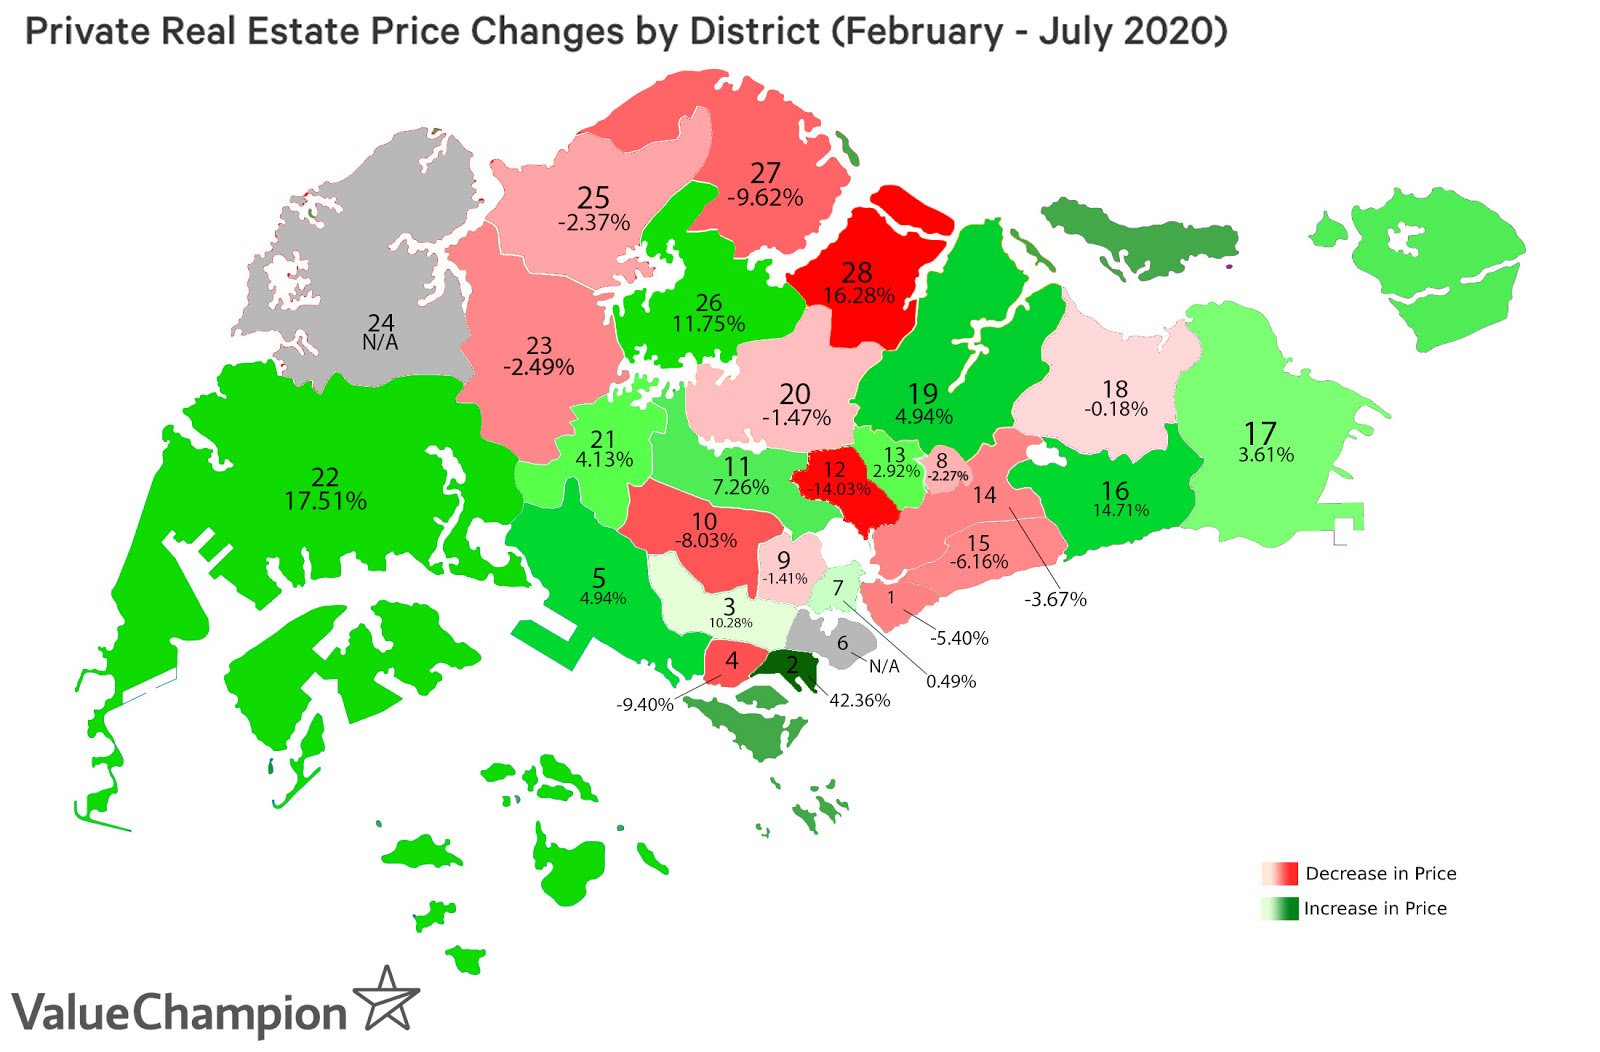
- Real estate in Singapore's central region was disproportionately affected during the height of the pandemic, as prices dropped by almost 14% between February and July, compared to the overall market's 7% price decline
- In contrast, real estate prices in neighborhoods in the outer regions of Singapore grew by 5.05%, indicating that during COVID-19 increased demand for properties outside of the city centre
- Cities like Hong Kong, New York, and Seoul experienced similar shifts in demand during the pandemic, suggesting that increased demand for real estate outside the city centre is a global phenomenon
The COVID-19 Pandemic Affected Singapore's Central Areas the Most
When COVID-19 hit Singapore, the city-state took swift measures to reduce spread as much as possible. Not only did restaurants, bars and other public areas shut down, but so did in-person transactional businesses like open houses and showrooms. This caused Singapore's typically healthy real estate market to experience months of turbulence. After peaking in February 2020, private real estate prices dropped 7.00% across Singapore. However, Singapore’s central neighborhoods seem to have taken the brunt of the impact, with an average price decrease of 13.70% between February and July.

This data suggests a few things. First, demand for private housing in the central districts may have dropped as people's housing preferences changed. Properties in the heart of downtown are typically coveted due to their proximity to work and attractions. However, consumers may no longer value this proximity due to COVID-19 and social distancing measures that have been put in place. With people moving away from these areas in search of housing in less dense and cheaper areas, popular areas like Postal District 1, which includes Raffles Place, Cecil and Marina ended up with a 12% drop in price per square foot at the height of the circuit breaker measures in April 2020. Neighborhoods like Harbourfront, Telok Blangah and Pasir Panjang also saw PSF declines of 7-8% between February and April, indicating COVID-19's effect on Singaporean preferences for space and affordability.
Private Housing PSF Between February and July 2020 (Central Districts)
| Postal District | January | February | March | April | May | June | July | % Change (Feb-July) |
|---|---|---|---|---|---|---|---|---|
| 1 | S$2,135 | S$2,262 | S$2,218 | S$2,002 | S$2,291 | S$2,280 | S$2,140 | -5.40% |
| 2 | S$2,836 | S$1,839 | S$2,335 | S$1,858 | S$1,989 | S$1,932 | S$2,618 | 42.36% |
| 3 | S$2,002 | S$1,818 | S$1,888 | S$1,885 | S$1,989 | S$1,980 | S$2,004 | 10.28% |
| 4 | S$1,646 | S$1,616 | S$1,497 | S$1,480 | S$1,596 | S$1,556 | S$1,464 | -9.40% |
| 5 | S$1,463 | S$1,471 | S$1,477 | S$1,368 | S$1,564 | S$1,582 | S$1,544 | 4.94% |
| 7 | S$2,452 | S$2,431 | S$2,277 | S$2,426 | S$1,856 | S$2,175 | S$2,443 | 0.49% |
| 8 | S$1,351 | S$1,430 | S$1,409 | S$1,322 | S$1,356 | S$1,705 | S$1,398 | -2.27% |
| 9 | S$2,527 | S$2,368 | S$2,151 | S$2,264 | S$2,295 | S$2,328 | S$2,334 | -1.41% |
| 10 | S$2,367 | S$2,163 | S$1,887 | S$2,139 | S$2,073 | S$2,214 | S$1,989 | -8.03% |
| Region Avg. | S$2,086 | S$1,933 | S$1,904 | S$1,860 | S$1,890 | S$1,972 | S$1,993 | 3.09% |
Outer Region Housing Prices Crawling Upwards Despite COVID-19 Market Shakeups
Making the move to the outer districts may increase commuting times and reduce access to social activities. However, with Covid-19 limitations, options like telecommuting and virtual get-togethers have become much more commonplace and Singaporeans may decide to swap the central region's commute, nightlife and prestige for more space, less crowds and cheaper apartments in more distant neighborhoods. Our data seems to suggest that that is exactly what has happened during the pandemic.
Unlike the price declines seen in the central regions of the island, the outer regions have actually increased in price between February and July 2020 by 5.05%. Neighbourhoods that are most distant from the central region like Upper Thomson, Springleaf, Novena and Thomson all saw real estate prices increase up to 17.51%. Interestingly enough, even heavily populated areas in the outer regions also saw price increases, with district 22 (which includes the heavily populated Jurong neighbourhood) seeing a 17.51% PSF increase between February and July. This suggests that while population density may have played a role in homeowner decisions during COVID-19, the overall consumer preference may have been to move out of the central area.
Private Housing PSF Between February and July 2020 (Outer Districts)
| Postal District | January | February | March | April | May | June | July | % Change (Feb-July) |
|---|---|---|---|---|---|---|---|---|
| 11 | S$1,799 | S$1,702 | S$1,507 | S$1,849 | S$2,057 | S$1,854 | S$2,141 | 7.26% |
| 12 | S$1,356 | S$1,383 | S$1,223 | S$1,512 | S$1,856 | S$1,361 | S$1,392 | -14.03% |
| 13 | S$1,605 | S$1,611 | S$1,456 | S$1,544 | S$1,738 | S$1,652 | S$1,783 | 2.92% |
| 14 | S$1,499 | S$1,521 | S$1,527 | S$1,583 | S$1,612 | S$1,534 | S$1,447 | -3.67% |
| 15 | S$1,614 | S$1,468 | S$1,393 | S$1,592 | S$1,620 | S$1,533 | S$1,654 | -6.16% |
| 16 | S$1,069 | S$987 | S$1,047 | S$1,040 | S$1,023 | S$1,193 | S$1,132 | 14.71% |
| 17 | S$1,054 | S$899 | S$926 | S$991 | S$1,116 | S$1,094 | S$1,153 | 3.61% |
| 18 | S$1,113 | S$1,200 | S$1,151 | S$1,288 | S$1,293 | S$1,242 | S$1,221 | -0.18% |
| 19 | S$1,207 | S$1,218 | S$1,153 | S$1,415 | S$1,377 | S$1,303 | S$1,351 | 4.94% |
| 20 | S$1,537 | S$1,591 | S$1,432 | S$1,670 | S$1,647 | S$1,569 | S$1,563 | -1.47% |
| 21 | S$1,463 | S$1,526 | S$1,371 | S$1,533 | S$1,568 | S$1,579 | S$1,826 | 4.13% |
| 22 | S$870 | S$991 | S$892 | S$944 | S$1,093 | S$991 | S$846 | 17.51% |
| 23 | S$1,041 | S$1,098 | S$980 | S$1,202 | S$1,199 | S$1,079 | S$1,076 | -2.49% |
| 25 | S$702 | S$781 | S$735 | S$587 | S$619 | S$820 | S$759 | -2.37% |
| 26 | S$942 | S$1,192 | S$1,146 | S$1,198 | S$1,180 | S$1,232 | S$1,185 | 11.75% |
| 27 | S$942 | S$1,019 | S$990 | S$1,100 | S$926 | S$980 | S$931 | -9.62% |
| 28 | S$1,215 | S$1,388 | S$1,458 | S$1,231 | S$1,545 | S$1,108 | S$1,007 | -16.28% |
| Region Avg. | S$1,237 | S$1,299 | S$1,273 | S$1,199 | S$1,310 | S$1,391 | S$1,298 | -0.08% |
COVID-19 Causing Similar Effects on Other Global Real Estate Markets
However, Singapore wasn't the only city whose real estate markets felt the impact of the Coronavirus. Our data suggests that pandemic has caused residents of other major cities ato shift their interest towards real estate in their city’s outer regions. For instance, New York City, which was the epicenter of the COVID-19 back in April, experienced similar real estate trends. Outer boroughs like Brooklyn, Queens, and Westchester averaged a 4% Y-Y increase in real estate prices when compared to Q2 of 2019. On the other hand, Manhattan has seen a significant 10.20% decline in pricing. Notably, Westchester, which is located the furthest distance out of these listed locations, saw the largest price increase of 6.90%.
| Location | 2020 Q2 Price Change (YoY) |
|---|---|
| Manhattan | -10.20% |
| Brooklyn | 0.10% |
| Westchester | 6.90% |
| Queens | 5.00% |
Similarly, Hong Kong’s real estate market has seen a substantial 29% decline during COVID-19 since its peak in October 2019. While prices decreased in both downtown and a few outer regions of Hong Kong, the more substantial drops were concentrated in its downtown districts. With this being said, not all of Hong Kong’s real estate has seen a decrease in price. Although areas such as Hong Kong Island, Kowloon, and Tsuen Wan have had a considerable drop in pricing–58.77%, 37.91%, and 21.35% respectively–other areas like Sai Kung, Yuen Long, and Tuen Mun have seen real estate prices soar by 19.91%-54.16%. In fact, outer districts transaction value surpassed central transaction value for the first time since 2000, indicating that the pandemic has created a unique increase in demand for homes in these regions.
| District | % Price Change (Jul. 2020 vs Oct. 2019) |
|---|---|
| Hong Kong Island | -58.77% |
| Kowloon | -37.91%% |
| Tsuen Wan | -21.35%% |
| Islands Districts | -9.19% |
| Tai Po | -4.81% |
| North | -3.60% |
| Shatin | 18.04% |
| Sai Kung | 19.91% |
| Yuen Long | 33.58% |
| Tuen Mun | 54.16% |
Lastly, the South Korean real estate market, which had been performing well for quite some time, has also experienced similar decline in it’s downtown pricing. Since the start of the pandemic, South Korea’s trading supply and demand index fell 8%, meaning that the number of buyers has decreased substantially in comparison to available sellers. Despite this, the sales price index for Gyeonggi-do, the outer province surrounding Seoul, increased by 3.91%. This growth is quite considerable seeing as the sales price index for Seoul saw a mere 0.37% increase within the same time frame.

What This Means For Singaporean Real Estate
It seems as though COVID-19 made more Singaporeans set their sights on real estate located further away from the city-state’s central neighborhoods. While there are many reasons why Singaporeans may be departing these central areas, we can speculate a few causes. Some residents may feel as though purchasing cheaper real estate is a worthy investment during this economic downturn. Others might simply want to distance themselves from congested areas that they feel are riskier. Lastly, the opportunity to work from home may have shifted demand from housing that is close to the office to housing in neighborhoods that have other benefits.
While real estate prices in the outer regions have been increasing in the past few years, it can be fair to argue that these increases can not be fully attributed to COVID-19. However, data still suggests that when the threat of COVID-19 increases, consumer sentiment shifts towards regions outside of city centres. As a second wave of the Coronavirus made its way through Singapore in July, we saw similar shifts in real estate patterns—the overall and the central region real estate market slightly fell again between June and the first half of August, while the outer regions saw a 10.70% increase. Thus, it is possible to surmise that while the pandemic remains a real global threat, these real estate pricing trends can be expected to persist.
Methodology
The data presented in this study has been collected from Singapore Urban Redevelopment Authority, Value Champion’s Hong Kong Real Estate Study, and Value Champion’s South Korea Real Estate Study, Hong Kong & New York data came from ValueChampion Hong Kong, Seoul data came from Value Champion Korea.
To understand the real estate price changes, we gathered the average price per square foot for private properties from each postal district. To see how prices have changed over time, we looked at changes annually and monthly. In order to understand how COVID-19 affected prices in particular, we selected two definitive months before and after the pandemic outbreak–January and July. We then grouped the postal codes into two segments, center and outer regions, and averaged out the percent change in price per square foot. This allowed us to see how the Coronavirus impacted the price in each district. For our study, we removed HDB prices as a majority of those neighborhoods reside in the outer districts, and could potentially skew the data results.