Singapore Property Prices Fall in Central, But Pockets of Price Increase In Other Areas
by - October 28, 2020Singapore boasts one of the most expensive real estate markets in the world. This is especially the case for private residential properties, since HDB flats are only available for citizens, and thus relatively protected from investor speculations. In order to slow down the market speculation that has driven up property prices, however, the Singaporean government has put in multiple measures to cool investor demand.
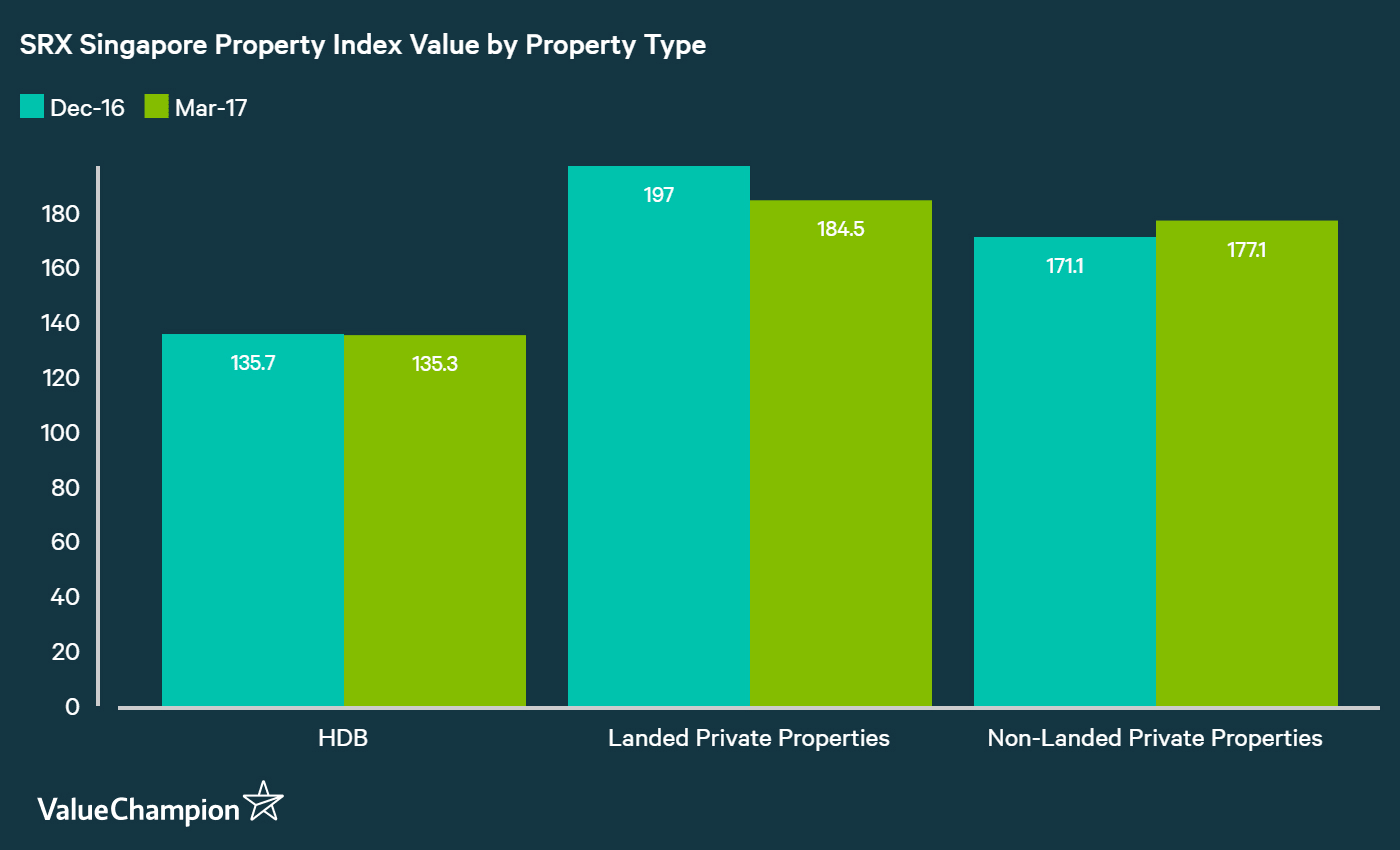
So far in 2017, property prices seem to be still falling on average, while consumers' debt leverage is increasing, a worrying sign for the economy. According to the SRX Property Index, property prices are in overall decline in Singapore, especially for both HDBs and landed private properties. However, while property prices are in decline overall, there were still pockets of price increases in some areas of Singapore. Below, we have prepared a study on property prices in Singapore to help prospective buyers plan out their purchases in advance.
Property Prices Are Generally Falling in Singapore, But Mostly in Central
Data from Urban Redevelopment Authority shows that there were meaningful increases in private property prices in non-central districts, as shown in our map below. Sure, the overall market was in an overall decline, but the most of the decline from the central area (i.e. postal district #9), where the median private property price per square foot declined by -46% to S$1,924 so far in 2017 from S$3,577 in 2016.

Median Price Per Square Foot of All Private Residential Property Transactions by Postal District (SGD)
| Postal District | 2014 | 2015 | 2016 | 2017 YTD | % chg |
|---|---|---|---|---|---|
| 1 | 2,220 | 2,118 | 2,027 | 2,008 | -1% |
| 2 | 2,005 | 1,914 | 1,812 | 1,824 | 1% |
| 3 | 1,666 | 1,625 | 1,639 | 1,682 | 3% |
| 4 | 1,475 | 1,383 | 1,368 | 1,602 | 17% |
| 5 | 1,248 | 1,182 | 1,200 | 1,282 | 7% |
| 8 | 1,956 | 1,300 | 1,205 | 1,448 | 20% |
| 9 | 3,072 | N/A | 3,577 | 1,924 | -46% |
| 10 | 1,331 | 1,484 | 1,520 | 1,858 | 22% |
| 11 | 1,417 | 1,481 | 1,553 | 1,593 | 3% |
| 12 | 899 | 2,056 | 912 | 1,267 | 39% |
| 13 | 1,191 | 1,200 | 1,130 | 1,373 | 22% |
| 14 | 1,131 | 1,055 | 1,087 | 1,557 | 43% |
| 15 | 1,335 | 1,290 | 1,161 | 1,678 | 45% |
| 16 | 1,002 | 968 | 903 | 1,384 | 53% |
| 17 | 846 | 929 | 802 | 834 | 4% |
| 18 | 790 | 960 | 780 | 1,015 | 30% |
| 19 | 1,174 | 1,116 | 1,039 | 1,046 | 1% |
| 20 | 1,194 | 1,239 | 1,099 | 1,258 | 14% |
| 21 | 1,297 | 1,263 | 1,178 | 1,140 | -3% |
| 22 | 897 | 858 | 723 | 821 | 14% |
| 23 | 1,031 | 916 | 904 | 791 | -13% |
| 25 | 867 | 788 | 708 | 761 | 7% |
| 26 | 1,136 | 1,085 | 1,046 | 1,040 | -1% |
| 27 | 874 | 757 | 489 | 812 | 66% |
| 28 | 1,150 | 1,133 | 901 | 870 | -3% |
HDB Prices Are Generally Falling in Singapore, But Not Everywhere
According to the data released by the Housing & Development Board, the median price of 4-room HDBs (the most common type of housing in Singapore) has fallen by -4% in Central so far in 2017 compared to its level in Q4 of 2016. However, the resale price of 4-Room HDBs increased in areas like Toa Payoh and Bukit Merah.

Median Resale Price of 4-Room HDB Flat by Town (SGD)
| Town | Q4 2014 | Q4 2015 | Q4 2016 | Q1 2017 | % chg |
|---|---|---|---|---|---|
| Ang Mo Kio | 418,000 | 464,000 | 469,000 | 460,000 | -1.90% |
| Bedok | 497,500 | 415,000 | 419,800 | 410,000 | -2.30% |
| Bishan | 420,000 | 535,000 | 602,000 | 547,500 | -9.10% |
| Bukit Batok | 455,000 | 402,000 | 405,000 | 411,000 | 1.50% |
| Bukit Merah | 425,000 | 640,000 | 604,000 | 630,000 | 4.30% |
| Bukit Panjang | 435,000 | 350,000 | 345,000 | 358,000 | 3.80% |
| Central | 451,000 | 835,000 | 845,000 | 811,500 | -4.00% |
| Choa Chu Kang | 418,000 | 353,000 | 345,000 | 343,000 | -0.60% |
| Clementi | 610,000 | 535,000 | 518,000 | 530,000 | 2.30% |
| Geylang | * | 500,000 | 550,000 | 513,800 | -6.60% |
| Hougang | 391,000 | 398,000 | 380,000 | 390,000 | 2.60% |
| Jurong East | 667,500 | 416,000 | 403,800 | 410,000 | 1.50% |
| Jurong West | 380,000 | 380,000 | 376,900 | 375,000 | -0.50% |
| Kallang/Whampoa | * | 546,000 | 518,000 | 574,000 | 10.80% |
| Pasir Ris | 425,000 | 397,000 | 400,000 | 395,000 | -1.30% |
| Punggol | 515,000 | 420,000 | 450,000 | 452,500 | 0.60% |
| Queenstown | 525,000 | 699,000 | 680,000 | 702,500 | 3.30% |
| Sembawang | 375,000 | 360,000 | 361,500 | 365,000 | 1.00% |
| Sengkang | * | 402,900 | 408,000 | 415,000 | 1.70% |
| Serangoon | 430,000 | 428,000 | 465,000 | 443,800 | -4.60% |
| Tampines | 400,000 | 420,000 | 430,000 | 423,000 | -1.60% |
| Toa Payoh | 368,000 | 530,000 | 565,000 | 631,000 | 11.70% |
| Woodlands | 583,500 | 365,000 | 350,000 | 350,000 | 0.00% |
| Yishun | 357,000 | 354,000 | 369,000 | 356,000 | -3.50% |
*Asterisks (" * ") refer to cases where there are less than 20 resale transactions in the quarter for the particular town and flat type. The median prices of these cases are not shown as they may not be representative
Falling Prices, but Rising LTV Ratio: Worrying Sign?
The average loan-to-value (LTV) ratio in Singapore has risen from 48% in 2014 to 53.4% by Q1 of 2017. While this may reflect consumer's willingness to borrow more in face of historically low interest rates, 3-month SIBOR has actually increased from about 0.4% in 2014 to 1.0% recently. Consumers may be less able to fund their property purchase with their own money, and may have become more reliant on bank home loans in spite of higher interest rates and lower property prices, a trend we also observed for car purchases.

Methodology
We analysed the housing transaction data from 2014 to April 2017 provided by both Urban Development Authority and Housing Development Board. For private residential properties, we gathered transaction data on each sale (new sale, resale and subsale) for every type of property in each of the 28 postal districts in Singapore. For HDB data, we collected HDB's qarterly median resale price for each type of HDB property from Q1 of 2014 to Q1 of 2017.
By comparing median price instead of the average price, we attempted to account for potential skews caused by atypical transaction prices. For private residential properties, we normalized prices by calculating price per square foot to make each period comparable. For HDBs, we compared the median transaction prices of 4-room HDB flats, which represent the highest proportion of housing in Singapore.
For private properties, we compared the median price in 2017 (Jan to April), compared to the median price of 2016 due to a smaller size of transactions in each quarter of 2016. In contrast, there were a record number of transactions so far in 2017, making its median number more representative. As for HDB price trends, we compared the Q1 2017 median price of 4-Room HDB flats to Q4 2016 prices to get to the most recent trends.