Is Healthcare Spending Disrupting the Education System in Singapore?

In his 2019 Budget Round-Up speech, Singapore's Finance Minister, Heng Swee Keat, defined the "Singapore Way" as putting people at the centre of all initiatives, working in partnership, and adapting to changing circumstances and needs. This rhetoric mirrors recent budgetary shifts which seem to downplay education and redirect focus to healthcare–all while the nation's 65+ year old demographic balloons and birth rate declines. What impact are these changes having on Singapore's world-class education system–are students still receiving the same quality of education and stable access to resources? In this study, we explore whether shifts in the budget are having an impact on students' success.
Study Highlights
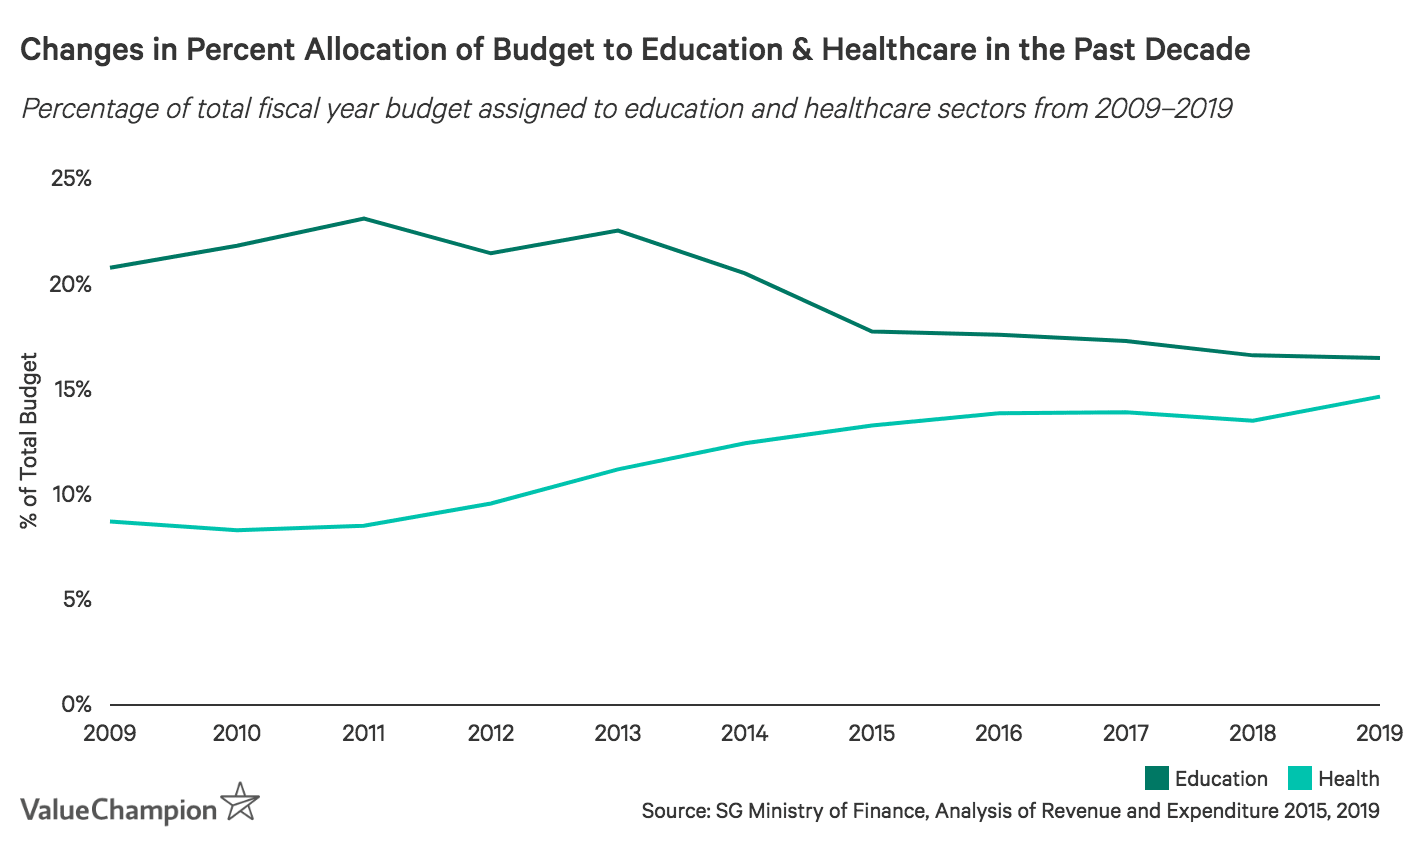
- Healthcare spending as a share of the annual budget increased from 8.67% in 2009 to 14.61% in 2019 (budgeted), while education's share decreased from 20.73% to 16.45% in the same period
- The nation's development budget for education has decreased 43% from 2008 levels
- Still, education metrics remain strong, with government expenditure per primary & secondary level students more than doubling from 2008 to 2018
- In fact, a decrease in number of students, caused by demographic change, may be the reason the education system continues to thrive even as education's budget share declines
Healthcare Budget Displacing Education Budget?
Since 2009, the education budget has decreased from 20.73% of total funds to just 16.45% in 2019 (budgeted). The healthcare budget, on the other hand, grew from 8.67% of the total budget to 14.61% during the same time period, with funds nearly quadrupling from S$3.6 billion in 2009 to S$11.7 billion in 2019 (budgeted).
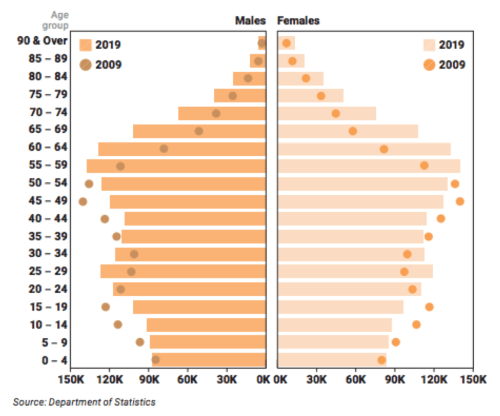
This trend largely reflects Singapore's ageing population, wherein residents are living longer while the fertility rate declines. In fact, the population proportion of those 65+ years old increased from 8.8% in 2009 to 14.4% in 2019, while the fertility rate has steadily declined from 1.60 in 2000 to 1.14 in 2018.
While the MOF prepares to inject at least S$13 billion into healthcare in 2020, the education of children in Singapore may seem, at first, as if it's been deprioritised. In fact, spend on education as a share of the annual budget has been shrinking since 2014, with education development expenditures reaching a decade low-point in the last financial year. As of 2018, there were just 340 government-aided schools (primary to junior college), down from 353 in 2014.
Change in % Education Budget Spent on Development Over Time
| Financial Year | Total Edu. Budget (millions) | Edu. Development Expenditure (millions) | % Edu. Budget Spent on Development |
|---|---|---|---|
| 2009-10 | S$8,685 | S$847.15 | 9.75% |
| 2010-11 | S$9,875 | S$876.74 | 8.88% |
| 2011-12 | S$10,740 | S$1,042.46 | 9.71% |
| 2012-13 | S$10,497 | S$859.60 | 8.19% |
| 2013-14 | S$11,638 | S$973.45 | 8.36% |
| 2014-15 | S$11,598 | S$886.01 | 7.64% |
| 2015-16 | S$11,935 | S$699.22 | 5.86% |
| 2016-17 | S$12,469 | S$656.66 | 5.27% |
| 2017-18 | S$12,691 | S$611.09 | 4.82% |
| 2018-19 | S$13,090 | S$450.00 | 3.44% |
| 2019-20 | S$13,200 | S$710.00 | 5.38% |
These changes, which may be a result of budgetary shifts towards healthcare, would at first seem to suggest stagnation, or even decline, within the school system. Additional data, however, suggests this may not be the case.
Quality of Education & Access to Resources Improves
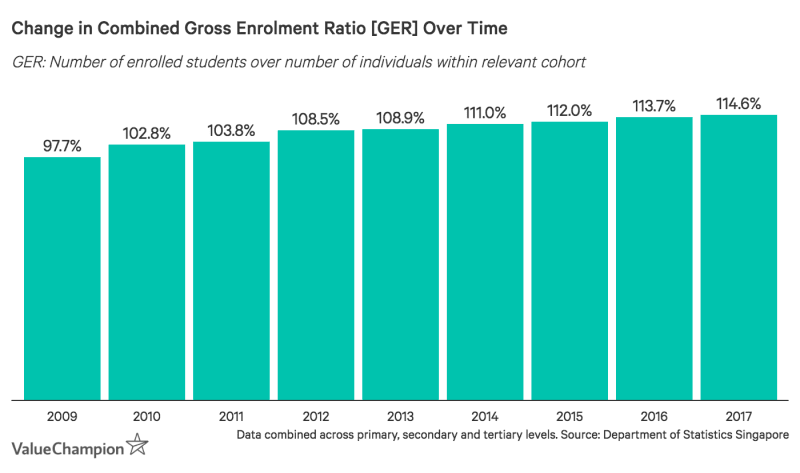
While education's share of the total budget has declined, so too has overall enrolment–resulting in an actual increase in resources available per student. To begin with, student enrolment in government and government-aided primary and secondary schools decreased 13.9% and 26.4% from 2008 to 2018, respectively. These decreases do not suggest that drop-out rates have increased or that more children are staying at home. Actually, the gross enrolment ratio–or number of enrolled students compared to the number of individuals in that age cohort–is actually higher than 100% when combined across primary, secondary, and tertiary levels. This suggests virtually all school-aged individuals are enrolled in classes, in addition to students outside the traditional age cohorts. Essentially, a decrease in total attendees cannot be attributed to class quality, but rather to shifts in Singapore's demographic. In terms of quality, the percentage of PSLE students who scored A*–C in math reached a high point of 85.5% in 2018, plus 90.6% in standard science the same year.
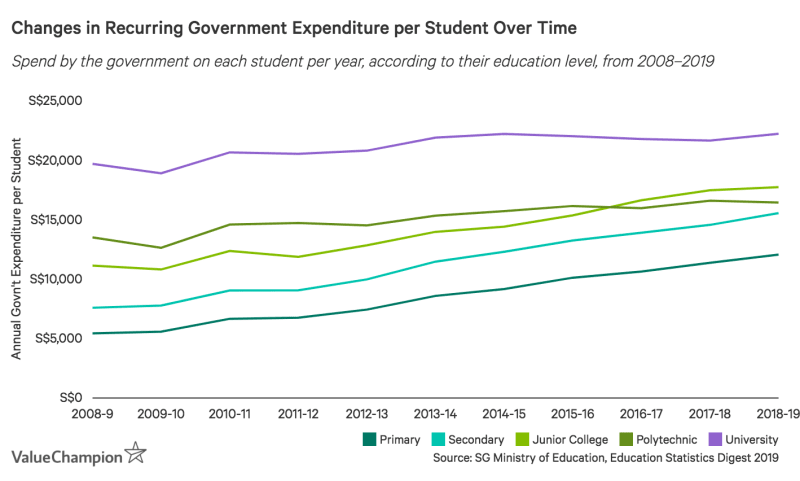
Interestingly enough, decreased enrolment levels has ultimately benefitted students. While the number of children attending school has decreased, the total education budget has still grown with time, thereby increasing the approximate expenditure per student. In fact, annual expenditure per primary and secondary student more than doubled from S$5,397 and S$7,551 in 2008, respectively, to S$12,020 and S$15,518 in 2018. A great deal of these funds are dedicated to operating expenses, which ensure continued access to special programmes, highly-trained teaching staff, and updated facilities. The MOE subsidised the education of 423,600 students within the 2019 fiscal year, making every Singaporean youth's education a priority. Even as its share within the budget decreases, the education sector has still continued to thrive.
A Look Into the Future
Singapore's demographic has undeniably shifted and continues to do so as longevity increases and the fertility rate declines. Ultimately, it makes sense that the national budget would reflect this trend, with a greater share of spend going towards healthcare than towards education. Other nations with ageing populations have similarly followed this path, and may make for a helpful reference as Singapore's demographic continues to mature.
Education v. Health Expenditure as % of GDP in Key Nations with Ageing Populations
| Country | % Population Aged 65+ | Education Expend. (% of GDP) | Health Expend. (% of GDP) | Difference, Education v. Health |
|---|---|---|---|---|
| Japan | 27.58% | 3.59% | 10.83% | 7.24% |
| Italy | 22.75% | 4.08% | 8.99% | 4.90% |
| Portugal | 21.95% | 4.88% | 8.97% | 4.09% |
| Finland | 21.72% | 6.90% | 9.49% | 2.60% |
| Germany | 21.46% | 4.80% | 11.14% | 6.34% |
| Singapore | 11.46% | 2.70% | 2.20% | -0.50% |
So far, Singapore's ability to balance budgetary changes with the priorities of its residents has proven quite successful. However, one potential concern is manpower in the education sector. Teacher salaries are currently lower than the national average; further budget compression may result in decreased staff, increased class sizes, or lower quality of instructors. To ensure skilled teachers do not seek higher-paying work elsewhere, Singapore's operating budget will need to remain strong even if other funds, such as those for education development, slow over time. Ultimately, maintaining a balance will become increasingly essential as longevity and the birth rate continue to skew the demographic.
Methodology & Limitations
The research and findings presented in this study are drawn primarily from government documents, news releases, and published digests with statistics. Key sources include the following:
- SG Ministry of Finance, Analysis of Revenue and Expenditure, Financial Year 2015 & 2019
- SG Ministry of Education, Education Statistics Digest 2019
- SG Ministry of Education, FY2019 Expenditure Estimates
- Department of Statistics Singapore, Population & Population Structure
- World Bank Group, Data & Charting
In order to better understand overarching trends, we studied changes in data over the past decade, focusing on a general range of 2008–2019. The credibility of this data is quite high, as it was sourced from Singapore's government. Nonetheless, high level statistics often sacrifice detail for the sake of simplicity. While we supplemented our budgetary research with external sources, such as news articles, there are still many nuances to Singapore's education and healthcare systems that may not have been captured. We are confident, however, that the ultimate impact of the shifting budget has been accurately represented and validated by comprehensive data.