Does Singapore Have the Highest Car Insurance Premiums in the World?

Singapore is known to be one of the most expensive places to own a car. Not only are car prices extremely expensive due to taxes and the Certificate of Entitlement (COE), but car insurance is commonly seen as being one of more expensive costs of maintaining a car. However, while it is true that Singaporeans pay a premium to own a car, do they actually pay more for car insurance compared to drivers around the world? We studied car insurance rates in several locations around the world, as well as factors that can drive car insurance costs up to find out who really pays the most for car insurance and why.
Key Findings
- The average Singaporean driver can expect to spend between 2-4% of their annual salary on car insurance (or about S$880-S$1,760 per month)
- New York City has the highest car insurance premiums out of the locations studied (4.8% of the median annual salary)
- Typically, women pay 10-12% less for car insurance than men; however, there are exceptions in Singapore, South Korea and the United States.
Singapore's Car Insurance Premiums Are Not the Highest
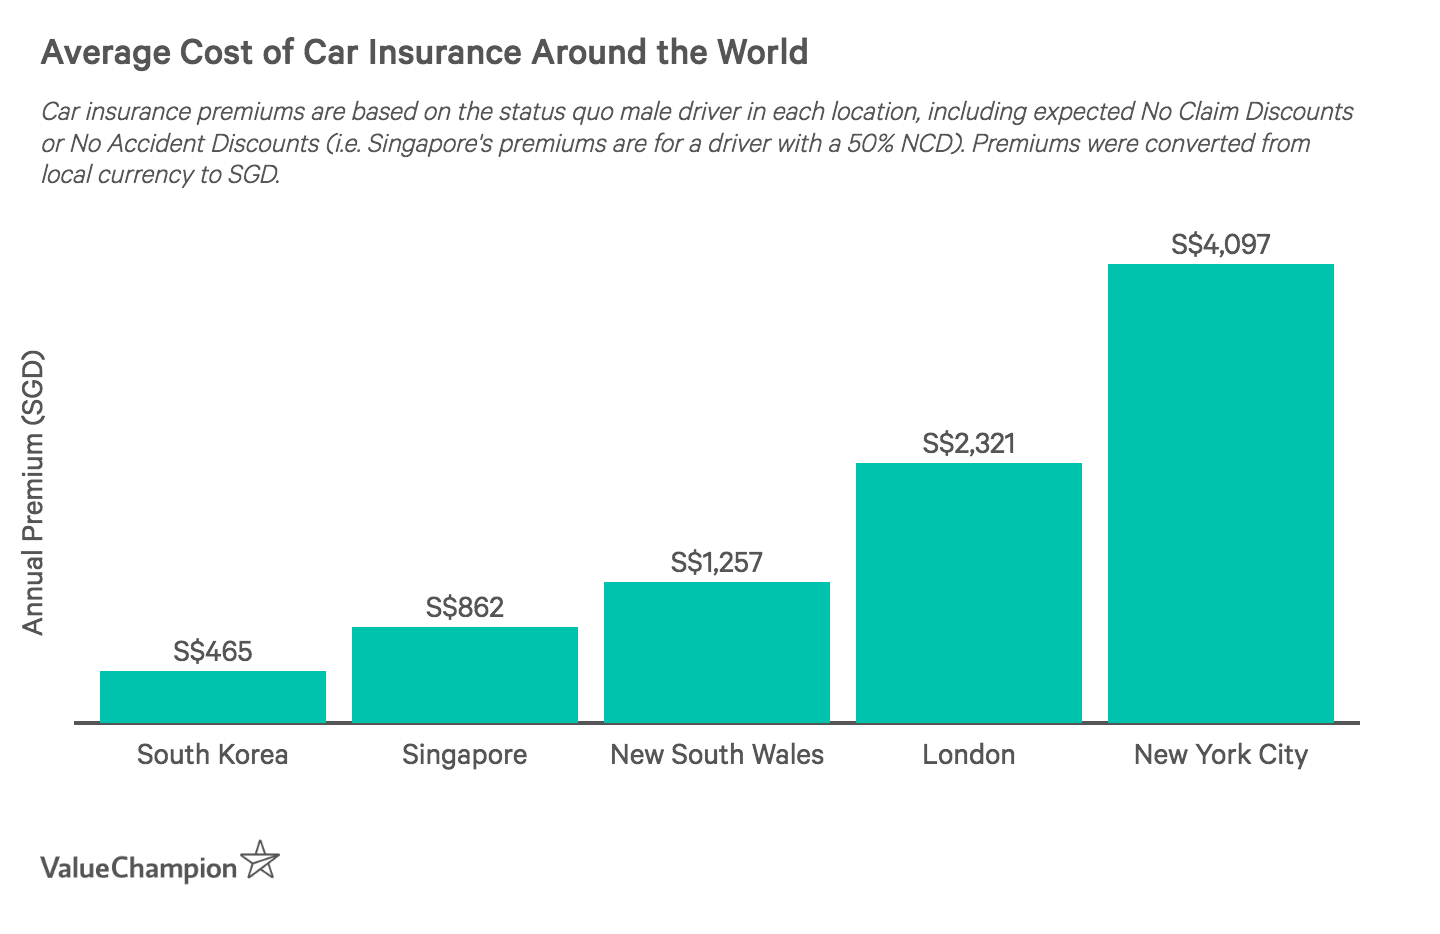
While it may seem like Singaporeans pay the highest car insurance rates, New York City actually takes the top spot for most expensive car insurance premiums out of the locations we analysed. In fact, the average annual motor insurance premium in New York is $2,973 (S$4,096.65)—over 1.3 times greater than even the average 0% No Claims Discount (NCD) car insurance premium in Singapore. On the other hand, out of the places we analysed, the average South Korean driver pays the least for car insurance with an average annual premium of 381,921 won (~S$467).
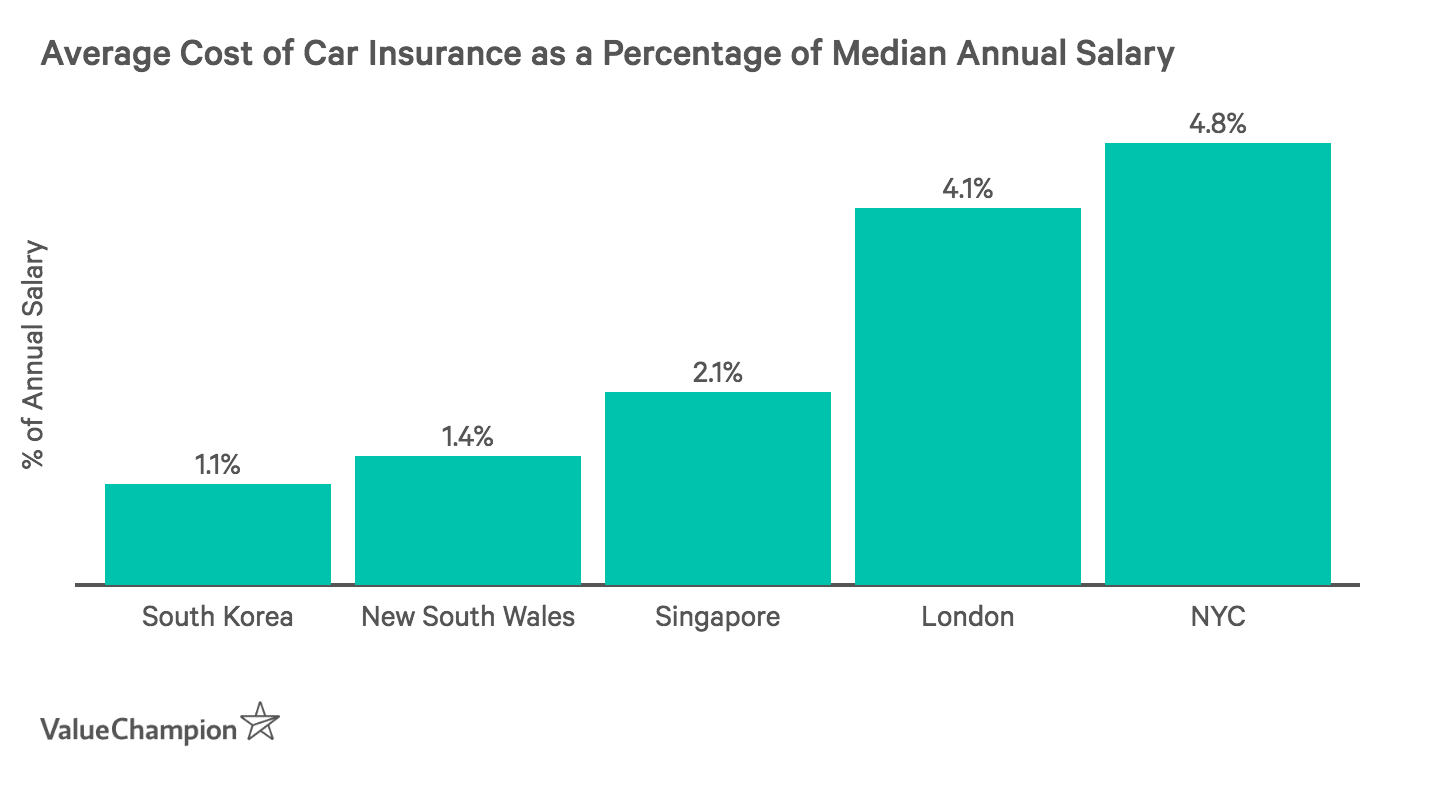
To get a better idea of exactly how financially burdensome car insurance is in Singapore in relation to the rest of the world we compared average monthly car insurance premiums to the median salary in each location. When looking at how much drivers spend on car insurance as a fraction of their annual salary, we found that Koreans spend the least on car insurance (1.1% of their annual salary) and that New Yorkers spend the most (4.8% of their annual salary). On average, Singaporeans spend less than New Yorkers and more than Koreans, depending on the driver's NCD, which is the discount insurers will add to your premium for driving for a certain number of years claim-free. For instance, while a Singaporean driver with a 50% NCD will spend only 2.1% of their annual salary on car insurance, the average driver with a 0% NCD may spend as much as 4% of their annual salary on car insurance premiums.
How are Car Insurance Premiums Calculated?
Regardless of where you go, your car insurance rates will depend on a few key factors ranging from age and gender to the car you drive and where you drive it. For instance, female drivers pay less than male drivers on average and young males and elderly drivers pay the most for car insurance. Furthermore, more expensive cars cost more to insure since their parts are pricier, leading to higher car insurance claims. Your location plays an important role as well, as premiums can vary significantly between neighborhoods, districts and territories. For instance, drivers living in more dangerous or densely populated areas pay more for car insurance than drivers living in low population density areas.
Last but not least, each insurer has their own set of data that helps them determine the most optimal car insurance rates. This can range from everything from the number of claims they received last year to the rate of inflation (increase in inflation means raising claim costs). Each country or city also has their own risk factors that they take into consideration. For instance, New York City car insurers also consider theft, vandalism and density rates in the driver's borough. Singapore car insurers consider claim data and driver occupation.
The Youngest & Oldest Drivers Pay Most for Car Insurance
While car insurance premiums varied differently among countries across different age groups, we did find a couple of commonalities. First, car insurance premiums were most expensive for people in their 20's. This makes sense considering that younger people are riskier to insure due to their lack of driving experience and tendency to be more accident-prone. We also noticed car insurance premiums started increasing again for elderly drivers, showing them to be a riskier demographic of drivers. This is most likely due to an age-related loss of motor skills and slower reflexes which can lead to a decline in driving ability.
Car Insurance Premiums for Different Age Groups
| Location | Ages 30-39 | Ages 40-49 | Ages 60-69 |
|---|---|---|---|
| New South Wales | S$1,607 | S$945 | S$810 |
| Singapore | S$934 | S$883 | S$926 |
| South Korea | S$495 | S$512 | S$644 |
| UK | S$1,503 | S$1,250 | S$1,241 |
| USA | S$2,626 | S$2,501 | S$2,392 |
| Premiums are for the average male driver with the maximum No Claims/Accident Discount for locations where applicable. Local currency converted to SGD | |||
However, this is where the similarities end. While Singapore, the UK and the United States saw a drop in car insurance premiums for 40-year olds compared to 30-year olds, car insurance premiums in Korea start increasing again after age 30. Furthermore, the United Kingdom, New South Wales and the United States show further drops in premiums for 50-year old drivers, Singapore and South Korea raise their premiums for this age group, indicating they may find older drivers riskier to insure than their western counterparts.
Women Typically Pay Less for Car Insurance
In most of the locations we considered, women pay less for car insurance premiums than men. On average we found that men tend to pay around 10-12% more than women on car insurance, especially when comparing male and female drivers in their 20's. This was true even in places where car insurers are not allowed to discriminate by gender, such as in the UK and Europe. This may be because the risk of insuring male drivers is greater than insuring female drivers, since males drive more frequently than women, are more likely to get into accidents, drive more expensive cars.
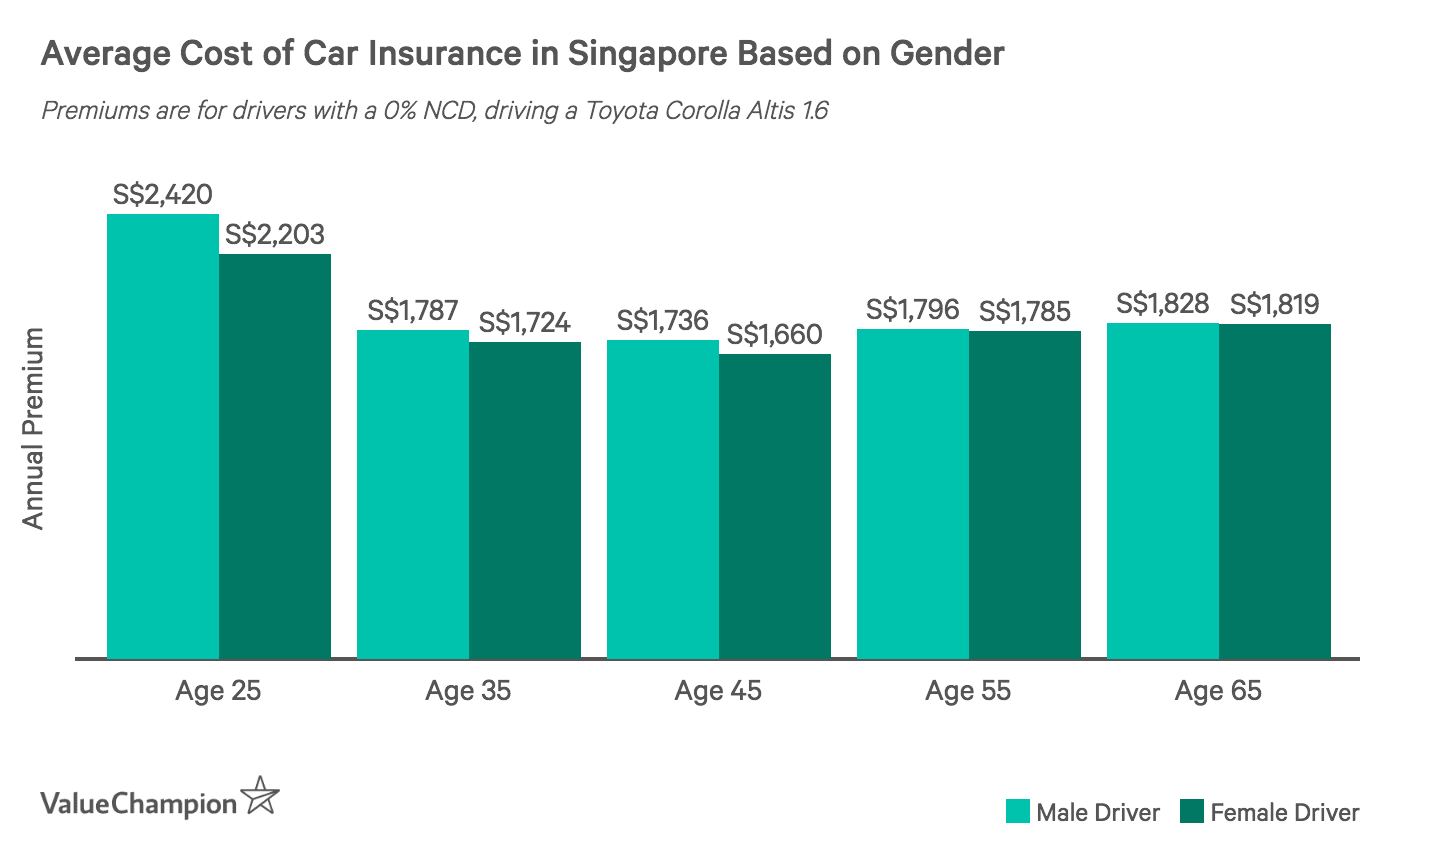
However, we found a few notable exceptions to this trend. For instance, while young Singaporean and Korean males who don't have an accident or claim-free discount pay 10-12% more than their fellow female drivers, females drivers can pay up to 7% more than male drivers when both genders have the maximum NCD or No-Accident Discount. Furthermore, after sampling some quotes from New York City insurers, we saw that females tend to pay slightly more than males after the age of 30. This is true on a nationwide scale as well, where we did not find one gender being priced consistently higher than another. This means that while statistically, male drivers are riskier to insure, it is not necessarily the primary factor behind car insurance premiums.
Density Matters More for Car Insurance Premiums than Fatality Rates
While a location's road accident fatality and accident rates may account for a portion of why a certain location charges very high car insurance premiums, they do not necessarily play the most important role when car insurers consider premium rates. For instance, the road fatality rates of New York and Singapore are the closest, with 2.51 and 2.16 road accident fatalities per 100,000 people in 2017, respectively. Despite these rates being quite low compared to the world average road fatality rate of 17.4, their average car insurance premiums can get relatively high. On the other hand, South Korea, which has one of the highest road accident fatality rates, has some of the lowest car insurance premiums.
| Location | Road Fatality Rate/100,000 Persons in 2017 |
|---|---|
| London | 1.50 |
| Singapore | 2.16 |
| New York City | 2.51 |
| New South Wales, Australia | 5.07 |
| South Korea | 9.86 |
Instead, it does seem like insurers weigh more on the location and density of where you live rather than historical accident trends. For instance, our research found that metropolitan and high density areas saw much higher insurance rates than low-density areas. This is because insurers believe higher density areas are riskier due to increased congestion, probability of crime and increased chance of accidents. This is evident in car insurance rates when comparing low density areas with high density areas. For instance, while the average premium in all of New York state is USD$1,450 and has a population density of 261 people per square metre, New York City has a population density of 11,001 people per square metre, with average car insurance premiums twice that of New York State. The same trend emerges when you compare New South Wales to Sydney and the United Kingdom to London.
How to Reduce Your Car Insurance Premiums
There are many ways to reduce your car insurance premiums. You should always start with comparing premiums across different insurers to make sure you're getting the best rate. Next, you should do what you can to be a safe and attentive driver to prevent costly accidents that lead to high claims. This means you should avoid being distracted, get your car routinely serviced and be honest with your insurer regarding who owns your car and how you drive it. Furthermore, you can also opt for a higher voluntary excess. While this means you will have to pay more out of pocket when you claim, your annual premium rates will be lower. Lastly, you can consider telematics devices which track your driving and can reward you with discounts if you go claim free for a certain period of time.
Methodology & Limitations
We gathered car insurance pricing information from several locations around the world based on each location's status quo driver including their expected discounts. This means Singapore and London both had a 50% NCD for the average driver, Korea had a 30% No-Accident Discount and New South Wales had their own safe driver discounts included in the premium. However, when comparing average premiums between Singapore and New York, we used Singapore's 0% NCD for comparison due to New York City not having a similar consideration in their average premiums. For places where we couldn't get city-specific data we used the country or the territory instead. This was the case for Seoul, Sydney and New York City (for age and gender-related comparisons). This means that we had to rely on national and territorial trends rather than precise figures for certain comparisons. However, the available data gave us the ability to analyse overall patterns and understand some of the logic behind how insurers price their car insurance policies.
We also looked at affordability of car insurance based on its percentage of the average person's salary. To get this figure, we divided the average premiums of the status quo driver by the median salary. The median salary, rather than the average salary, was used because it is representative of the general population's wages as opposed to the average. However, these figures may not be representative of every individual due to the plethora of factors that go into car insurance premiums.

Anastassia is a Senior Research Analyst at ValueChampion Singapore, evaluating insurance products for consumers based on quantitative and qualitative financial analysis. She holds degrees in Economics and International Business Management and her prior working experience includes work in the capital markets sector. Her analyses surrounding insurance, healthcare, international affairs and personal finance has been featured on AsiaOne, Business Insider, DW, Vice, Her World, Asia Insurance Review, the Australian Institute of International Affairs and more.