Probability of Getting in a Car Accident in Singapore

Singapore is known for its law abiding citizens and high safety standards. But are Singaporeans also safe drivers? How safe is it to drive in Singapore, and how does driving in Singapore compare with other countries? We looked at official traffic accident statistics from Singapore and other countries around the world to answer this question.
Probability of Getting in A Car Accident in Singapore is Increasing
We found that the roads in Singapore have become a little more dangerous over the past few years. First, the total number of accidents resulting in injuries has increased by 8.9% since 2020. In the area of road fatalities, Singapore has experienced an even bigger change. There has been a significant increase since 2020 in the number of car accidents that result in fatalities. From 2020 to 2021, the number of fatal accidents rose from 80 to 100 annually.
However, it's important to note that this number is still lower than those reported before the breakout of the COVID-19 pandemic, when the annual number of fatal road accidents were consistently above 100.

Singapore is More Dangerous Than Its Peers Around the Globe
While our research indicates that road safety in Singapore is improving over time, our findings also suggest a possibility that in reality, fatal car accidents occur with higher frequency here than public perception. In fact, drivers in Singapore may actually be more dangerous than drivers in other high-wealth countries such as the United States, Japan, the United Kingdom and Canada.
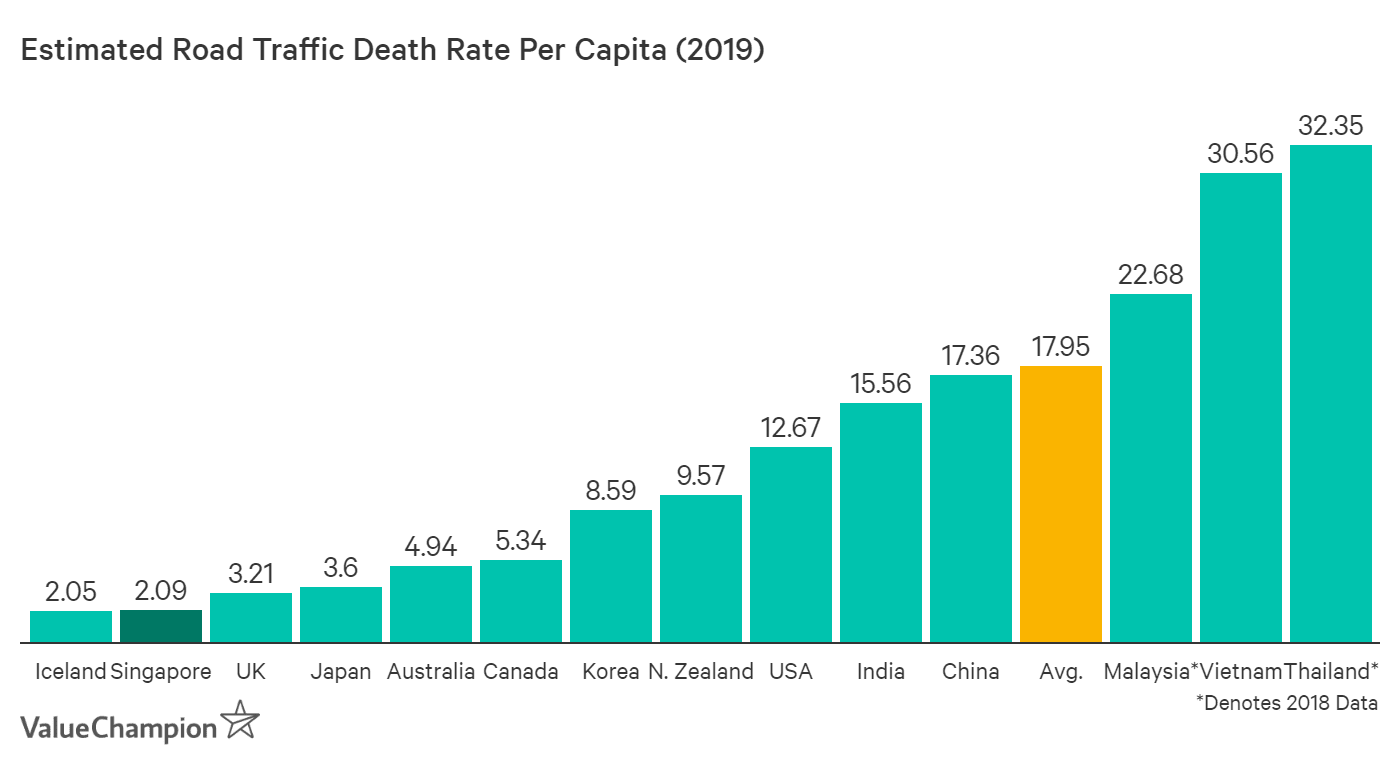
Road Fatalities Per Capita Is Deceiving
On the surface, Singaporeans may seem to be safer drivers than their counterparts in other developed countries. For instance, Singapore has among the lowest road mortality rates per capita in the entire world. Based on our analysis of official data issued by the Singapore Traffic Police and statistics compiled by the World Health Organization, we found that Singapore had the 6th least number of road accident-caused fatalities per capita out of the 178 countries assessed for the year of 2019, reporting only 2.09 fatalities per 100,000 people. The only countries that could boast fewer fatalities per capita in 2013 were Antigua & Barbuda (0), the Federated States of Micronesia (0.16), Maldives (1.63), Kiribati (1.92) and Iceland (2.05). Since 2013, Singapore's road mortality rate per capita has continued to decline, as there were only 2.09 road fatalities per 100,000 persons in 2019.
Accidents Per Motor Vehicle Shows the True Picture
However, while road fatalities per capita in Singapore is very low, our research suggests that Singapore is not the paragon of road safety frequently-cited statistics indicate; rather, it is actually more dangerous to drive in Singapore than many other well-developed countries. For example, we found that road fatalities per vehicle on the road is actually relatively high. In 2019, there were 12.13 fatalities per 100,000 motor vehicles. While this is down from 20.4 fatalities per 100,000 motor vehicles in 2010, it is nonetheless significant that the fatality rate per vehicle is so much higher than the fatality rate per capita.
By using this measure, Singapore contrasts unfavorably to countries like Japan, UK, Australia, Canada and many other countries that Singapore outperformed on the basis of road mortality per capita.

Note that for these other countries, their performance on the basis of road mortality per capita and road mortality per vehicle do not significantly differ. This discrepancy may be explained in part by the fact that compared to many highly developed countries, a significantly lower percentage of Singapore's population actually owns a car, while a higher percentage utilize public transit. As of 2018, an estimated 35% of Singapore households owned a car, down from 42% in 2013. This stands in stark contrast to high level of car ownerships in other developed countries. Thus, this large portion of the population in Singapore is comparatively infrequently exposed to the risks of travel by motor vehicle, and their likelihood of getting into a car accident is much lower.

| Country | Percent of Households that Own a Car in 2018 |
|---|---|
| United States | 91% |
| France | 85% |
| Germany | 85% |
| Korea | 83% (2014) |
| Malaysia | 82% (2014) |
| Japan | 81% (2014) |
| United Kingdom | 76% |
| Singapore | 35% |
As a result, the per capita basis for measuring road safety paints a misleading picture of how safe it actually is to travel by car in Singapore. Instead, driving Singaporeans should consider the number of car accidents and fatalities per vehicle to be a more accurate reflection of road safety.
Probability of Car Accidents Correlate with Car Insurance Premiums
It seems that people in countries where traffic accidents are more common may tend to pay more for their car insurance. To see if there's any correlation between dangerousness of roads with costs of car insurance, we compared insurance premium prices in the United States, Korea, India, the United Kingdom, Australia, India and Singapore. To approximate the amount of money someone would need to spend on their car insurance relative to their wealth, we compared each country's average car insurance premium as a percentage of Gross National Income (GNI) per capita.
Interestingly, we found a strong positive correlation of 0.99 when comparing road accident fatalities per capita and insurance premiums as a percentage of the GNI. This means that the higher the fatality per vehicle rate, the more expensive insurance premiums will be for that nation. For instance, India has the highest fatality rates per 100,000 vehicles out of the 6 countries and its car insurance premiums are the most expensive relative to the nation's wealth. Countries with lower road accident fatality rates, like Australia, have much cheaper car insurance rates. One deviation we found was with the United States, which has the cheapest relative car insurance premiums, but has the third highest fatality rate. This may be because car insurance rates in the United States fluctuate from state to state depending on a myriad of factors including how competitive the auto insurance industry is in each state, the chance of inclement weather damaging the car, the state's history of insurance fraud, the uninsured driver rate and other factors that insurance companies may prioritise over the accident rates.

Methodology
Our findings are based on statistics culled from publicly accessible and official reports and datasets published by the Singapore government (the LTA, Singapore Traffic Police and other sources), the Organisation for Economic Co-operation and Development (OECD), Pew, the United Nations and the World Health Organisation (WHO). We collected data on the number of car accidents, fatal accidents, human population, vehicle population and road mortality rates for countries around the world to analyze trends in the frequency of car accidents from 2010 to 2019. Generally, data culled from international organizations reflect estimates; if interested, information regarding their methodology is available on their websites.Where estimates from international organisations such as the WHO/World Bank differed from data released by the Singapore government, we elected to use the official Singapore figures.
In collecting car insurance quotes, we used the most common profile of a 45-year-old single male driver with at least a few years' driving experience driving the most popular sedan (a car with an engine of approximately 1,500-1,600 cc's). We sourced average quotes from major insurers in Singapore, Australia, the United States, Korea, India and the United Kingdom. We made efforts to standardize quotes across the 5 countries surveyed despite variations in the car insurance market in each country.
Note: This article was originally published in 2017. We updated it to see whether our initial findings have changed with the availability of more recent data.

Anastassia is a Senior Research Analyst at ValueChampion Singapore, evaluating insurance products for consumers based on quantitative and qualitative financial analysis. She holds degrees in Economics and International Business Management and her prior working experience includes work in the capital markets sector. Her analyses surrounding insurance, healthcare, international affairs and personal finance has been featured on AsiaOne, Business Insider, DW, Vice, Her World, Asia Insurance Review, the Australian Institute of International Affairs and more.